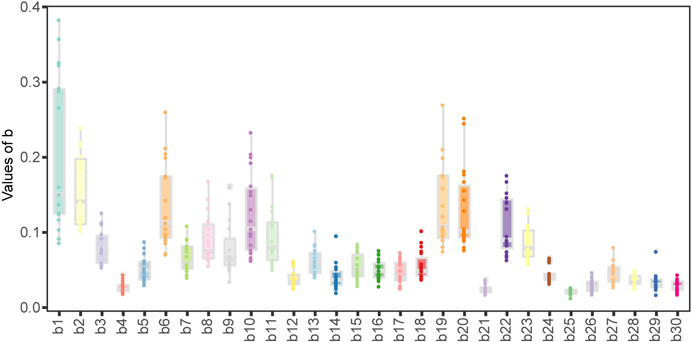
Extended Data Fig. 3.
The weights of the TCR embeddings learned from tessa. The X axis shows the digits of the 30-dimensional embeddings, and the Y axis shows the weights learned for all datasets. Each bar represents one digit of the weights and shows the values of that digit obtained from all the 19 scRNA datasets in the Supplementary Table 1.

