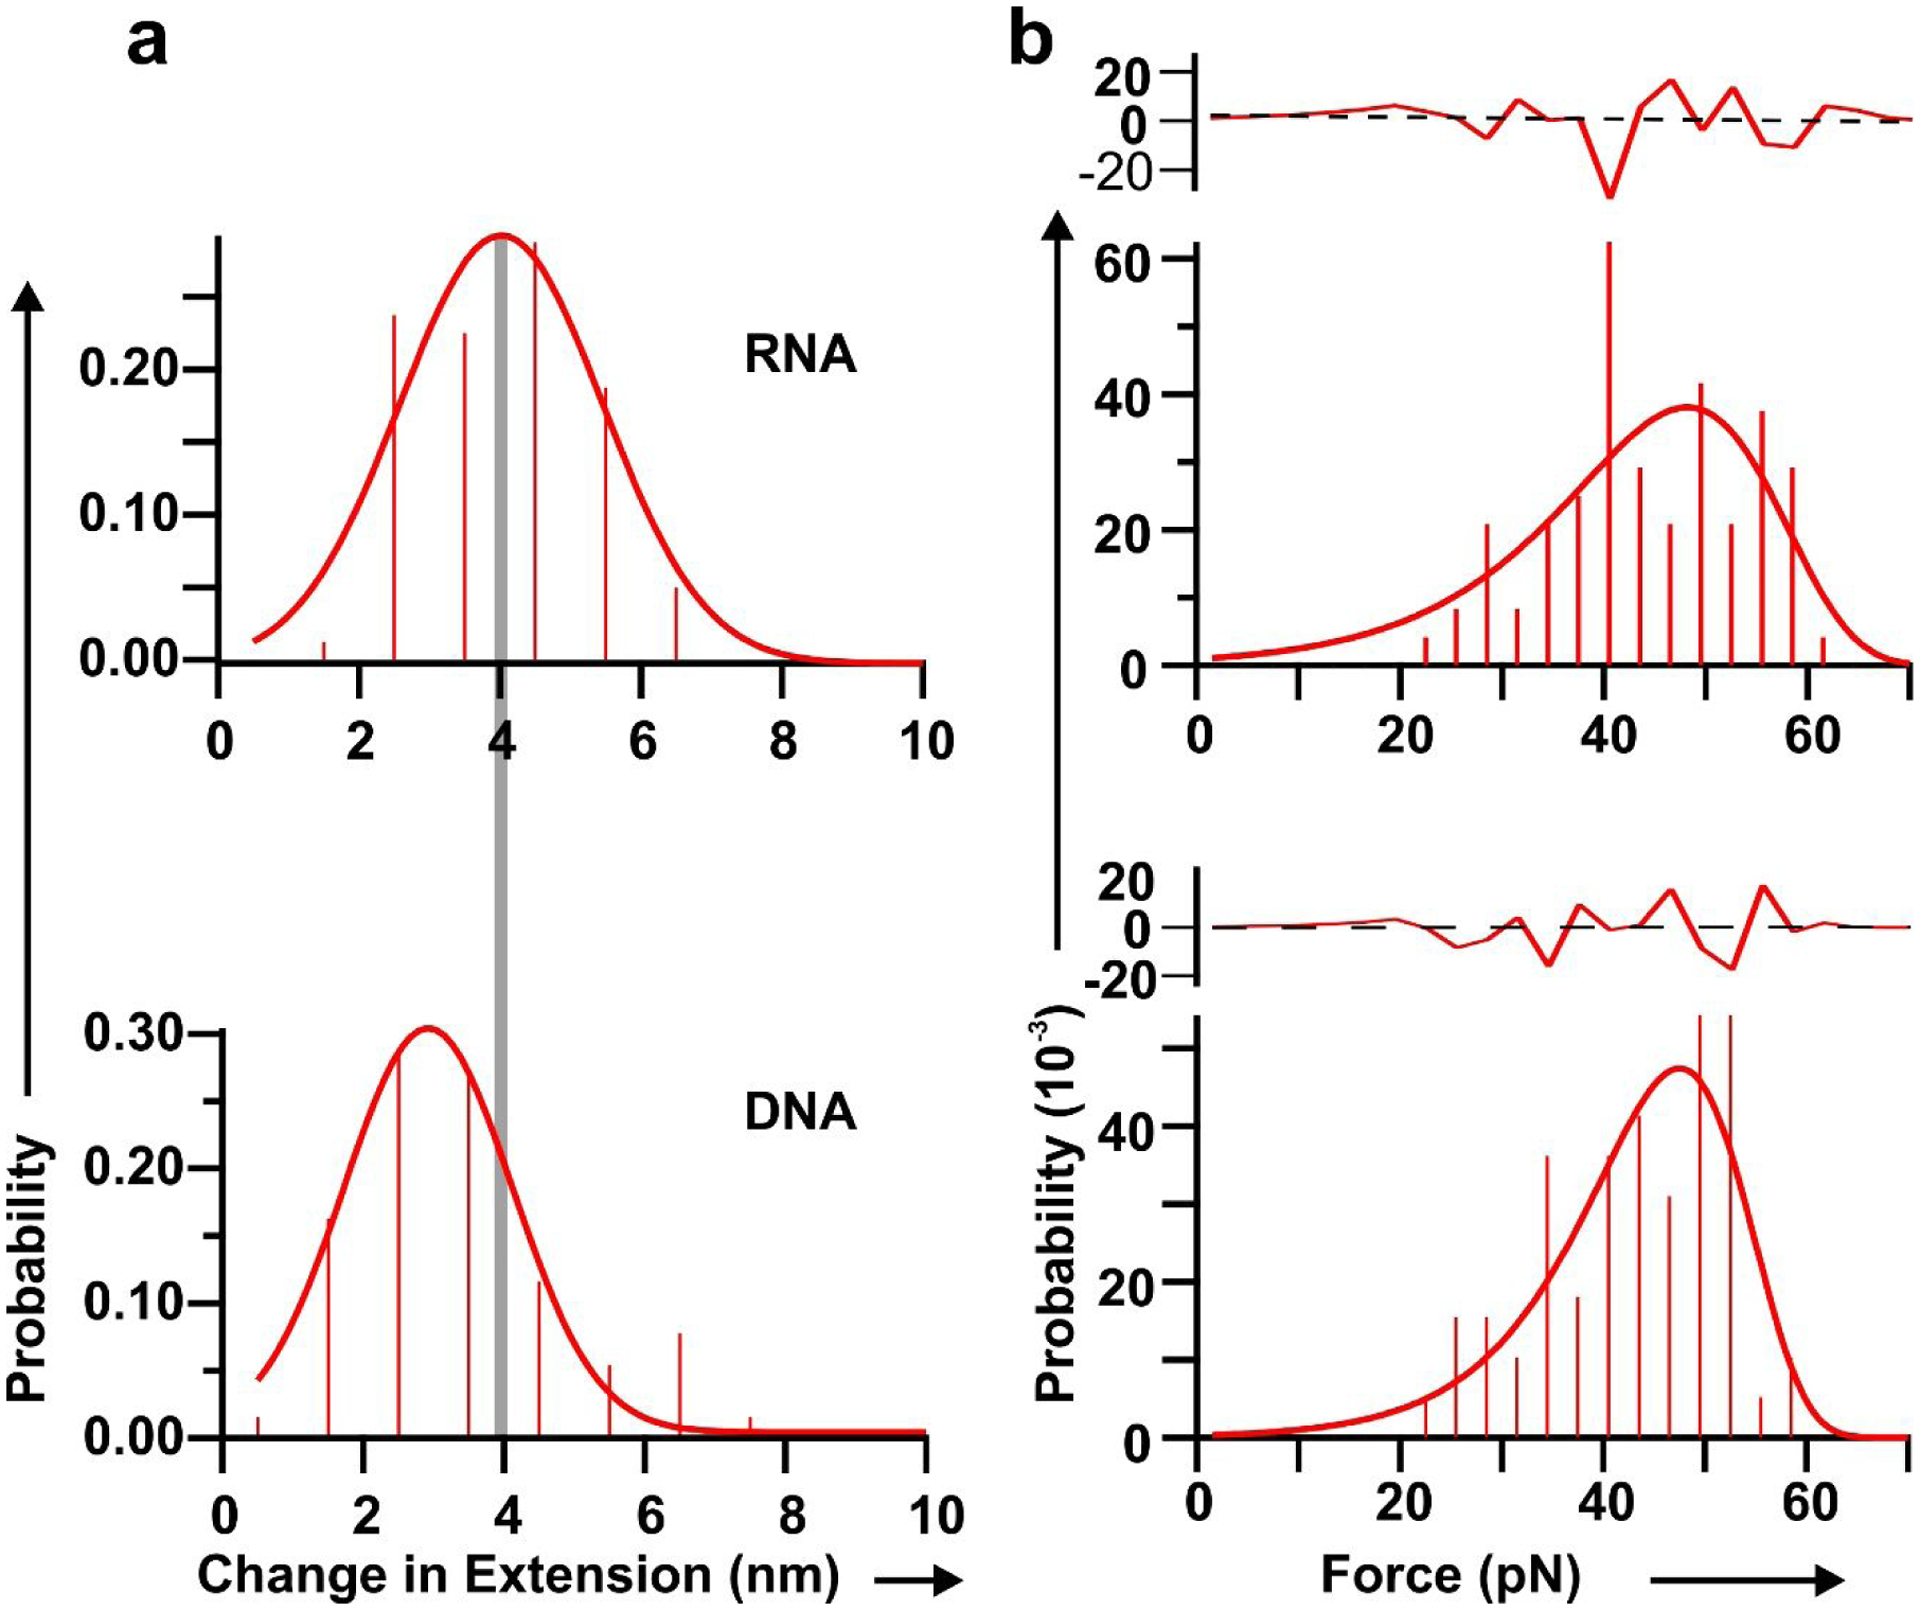
Fig. 4. Histograms of change in extension and force measurement for RNA (Top), and DNA (bottom).

a. Change in extension from change in conformation. The grey line depicts the center of the histogram peaks. b. Histograms of force to change conformation measured from force-extension curves for different nano-squares. Each force histogram is fitted with the Dudko equation71 (solid line). Residuals of fitting are shown above each histogram. The black dotted lines depict average values.
