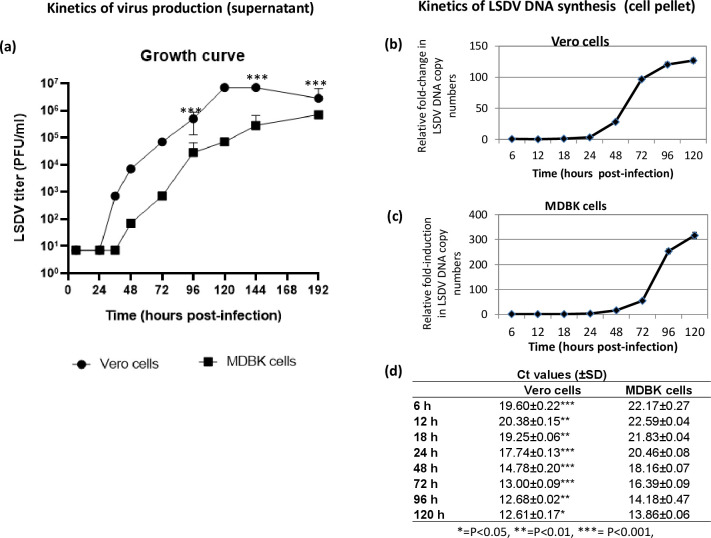
Fig 3. LSDV life cycle.
Vero/MDBK cells, in triplicates, were infected with Vero cell-adapted LSDV at MOI of 5 for 2 h followed by washing with PBS and addition of fresh DMEM. Growth curve. Supernatant was collected from the infected cells at indicated time points and quantitated by determination of TCID50 (expressed as PFU/ml) in Vero cells. Values are means ± SD and representative of the result of at least 3 independent experiments. Growth curve in Vero and MDBK cells (a) is shown. Kinetics of viral genome synthesis. Cells were scraped at indicated times points and the levels of viral DNA/β-actin (house-keeping control) gene in the infected cells (pellet) were measured by qRT-PCR. The levels of LSDV DNA, expressed as threshold cycle (Ct) values, were normalized with β-actin to determine relative fold-change in copy number of viral DNA. Kinetics of DNA synthesis in Vero (b) and MDBK cells (c) is shown. To directly compare the levels of viral DNA in Vero and MDBK cells at different times post infection, Ct values are also shown (d). Values are means ± SD and representative of the result of at least 3 independent experiments. Pair-wise statistical comparisons in the viral titres/Ct values between Vero and MDBK cells (at each time point), were performed using Student’s t test. * = P<0.05, ** = P<0.01, *** = P<0.001. The differences in the viral titres between Vero and MDBK cells are apparently significant at each time point except the lag phase (up to24 hpi). However, the statistical calculation is only possible at certain time points viz; 96 hpi, 144 hpi and 192 hpi where there are variations in the biological replicates.

