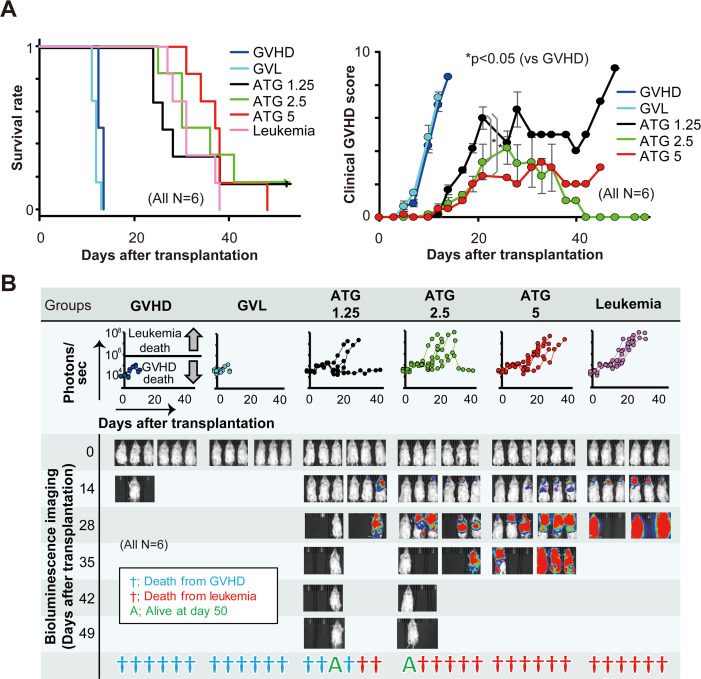
Fig 2. Comparison of survival, clinical GVHD score, and tumor burden among GVHD, GVL with/without ATG treatment (1.25, 2.5, and 5 mg/kg), and leukemia mouse models.
We allocated the mice into six groups: GVHD, GVL, leukemia, and ATG at doses of 1.25, 2.5, and 5 mg/kg (n = 6 each). The mice were observed every day following transplantation for survival estimates and every other day to calculate their clinical GVHD scores (A). Bioluminescence imaging with photons for each group and the status of the mice were observed for 50 days following transplantation (B). The line graphs in the middle row show the whole-body bioluminescence photons. Blue, red, or green symbols represent the status of the mice at day 50 for GVHD death, leukemia death, or survival, respectively.

