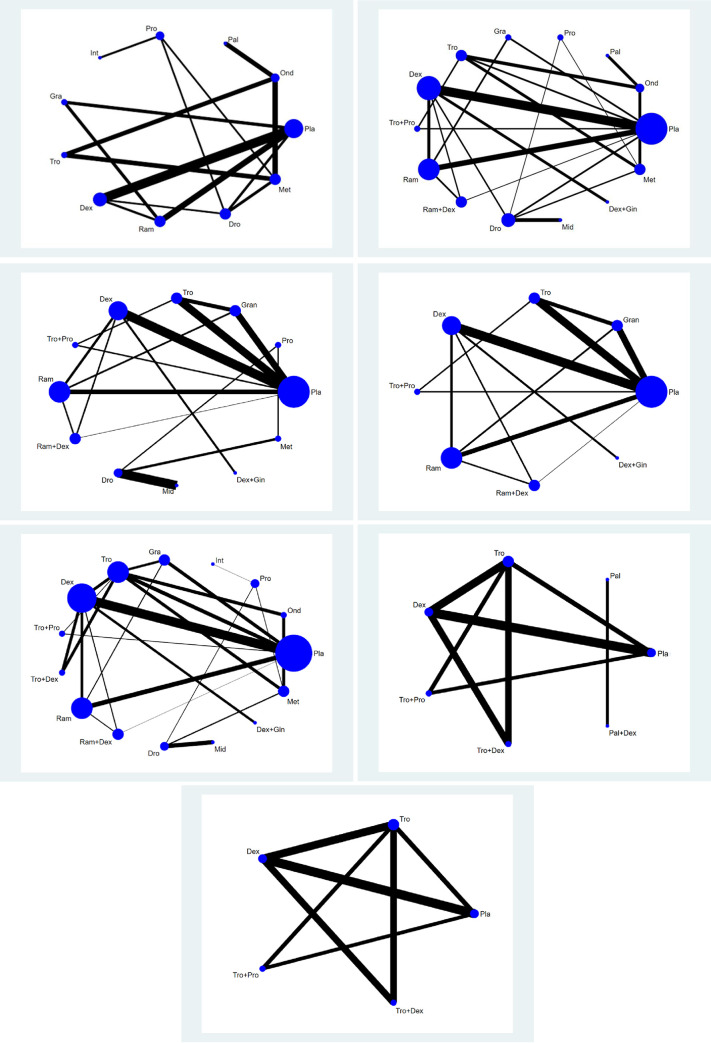
Fig 2. Network plot of included studies comparing different pharmacological strategies.
A: PONV, B:.PON, C1: POV, C2: POV excluding separate loops, D: use of rescue anti-emetics. E1: complete response, E2: complete response excluding separate loops. The nodes show a comparison of pharmacological regimens to prevent PONV and the edges show the available direct comparisons among the pharmacological regimens. The nodes and edges are weighed on the basis of the number of included patients and inverse of standard error of effect.

