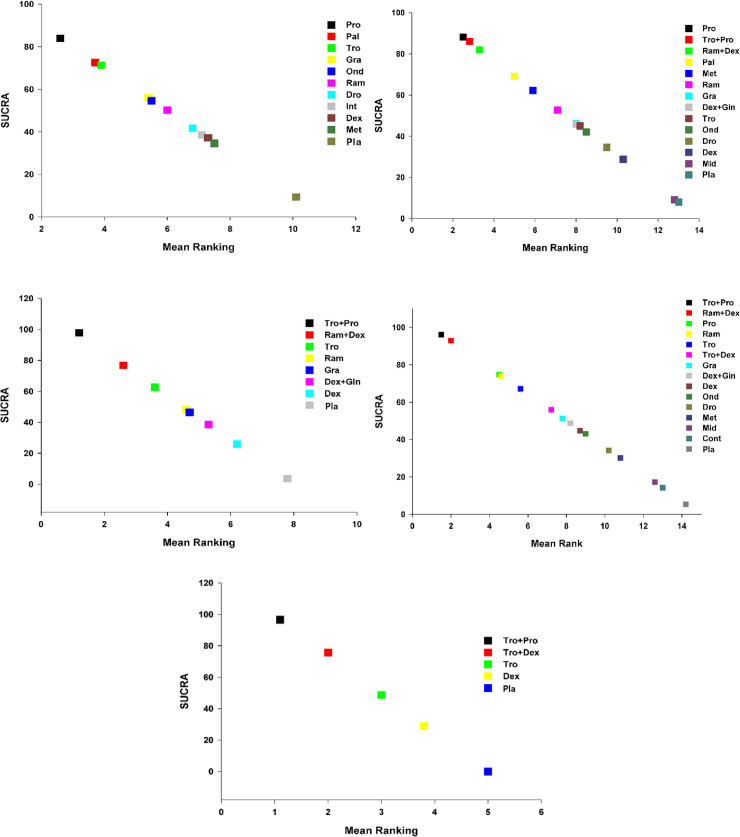
Fig 3. Expected mean ranking and SUCRA values for PONV.
A. X-axis corresponds to expected mean ranking based on SUCRA (surface of under cumulative ranking curve) value, and Y-axis corresponds to SUCRA value. Fig 3B. Expected mean ranking and SUCRA values for PON. X-axis corresponds to expected mean ranking based on SUCRA (surface of under cumulative ranking curve) value, and Y-axis corresponds to SUCRA value. Fig 3C. Expected mean ranking and SUCRA values for POV. X-axis corresponds to expected mean ranking based on SUCRA (surface of under cumulative ranking curve) value, and Y-axis corresponds to SUCRA value. Fig 3D. Expected mean ranking and SUCRA values for use of rescue anti-emetics. X-axis corresponds to expected mean ranking based on SUCRA (surface of under cumulative ranking curve) value, and Y-axis corresponds to SUCRA value. Fig 3E. Expected mean ranking and SUCRA values for complete response. X-axis corresponds to expected mean ranking based on SUCRA (surface of under cumulative ranking curve) value, and Y-axis corresponds to SUCRA value.

