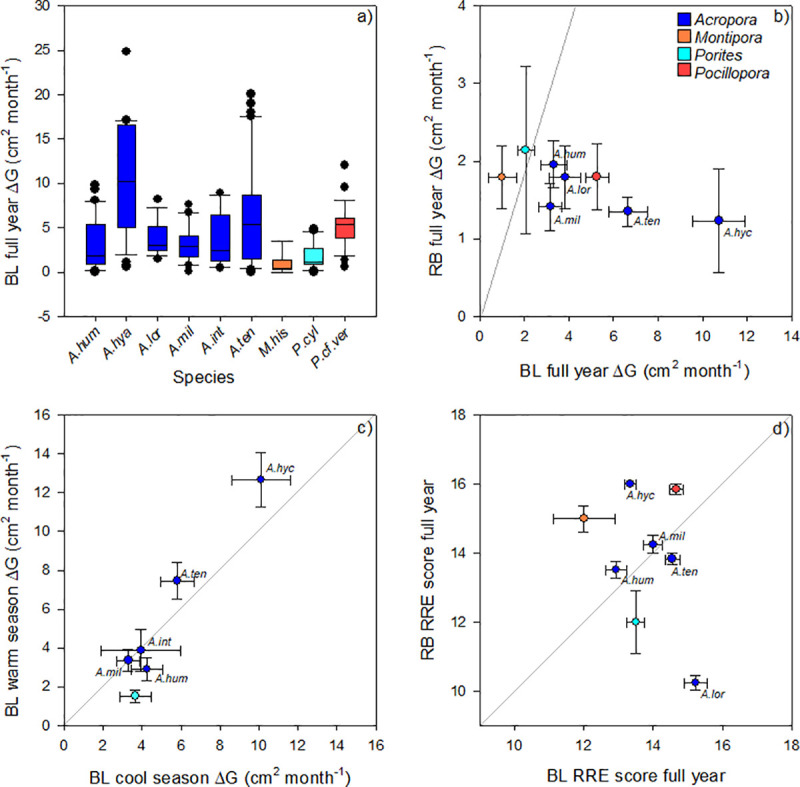
Fig 2.

Comparisons of (A) Growth rates (areal extension; ΔG, cm2 month-1) measured over the full year (August 2018-July 2019) for the 9 coral taxa maintained at Blue Lagoon (BL) nursery: Acropora humilis (A.hum), Acropora hyacinthus (A.hya), Acropora loripes (A.lor), Acropora millepora (A.mill), Acropora intermedia (A.int), Acropora tenuis (A.ten), Montipora hispida (M.his), Porites cylindrica (P.cyl) Pocillopora cf. verrucosa (P.cf.ver). Box plots for ΔG show the interquartile range (representing 50% of data) and mean (horizontal line)–whiskers extend to the maximum and minimum values of data and excluding outliers (lie outside the 10th and 90th percentiles) (B) Mean (± standard error) ΔG of comparative species grown over a full year at BL versus at RayBan (RB; May 2018-February 2019) nurseries; (C) Mean (± standard error) ΔG of species grown at BL for data collection periods August-December 2018, “cool season” (Fig 1), versus December 2018-July 2019, “warm season” (as per S4 Table); (D) Mean (± standard error) for the RRE score of comparative species grown over a full year at BL versus RB (Table 1). Diagonal line in plots (b-d) signify 1:1.
