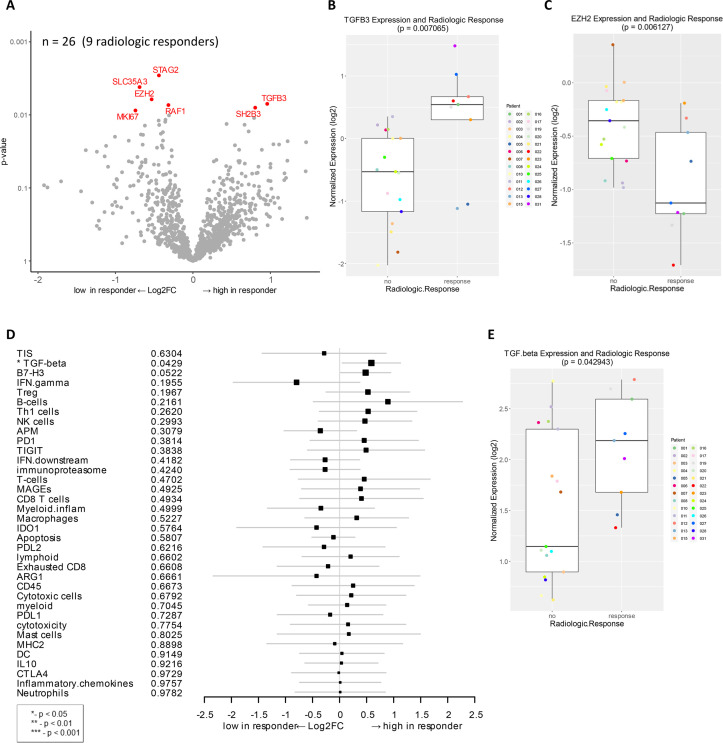
Fig 2. Genes and signatures associated with radiologic response in patients treated with combination immunotherapy of HDI and ipilimumab as a neoadjuvant therapy.
A) Volcano plot of unadjusted p-value vs. log2-fold change of the differential expression in patients who demonstrated radiologic response (unadjusted p < 0.01). Among 27 evaluable patients, 26 samples (9 radiologic responders) were available for analysis. B) Boxplot of TGFB3 expression and radiologic response. C) Boxplot of EZH2 expression and radiologic response. D) Forest plot of difference of gene signature scores between low expression and high expression in radiologic responders. The position of the squared dots denotes the difference of score, and the size denotes the statistical significance. The horizontal lines are the Wald-type confidence intervals. The * sign denotes the significance of p-value (< 0.05*). E) Boxplot of TGF-beta signature score and radiologic response.

