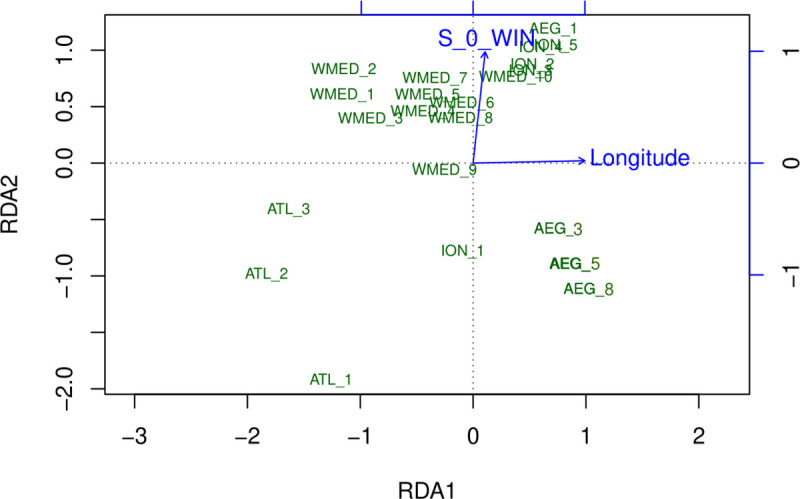
Fig 3. PCA of the redundancy analysis performed using outlier SNP dataset.

Sampling groups are labeled according to the genetic clusters identified with Structure and AMOVA and plotted according to the most explanatory axes. Longitude and surface winter salinity (S_0_WIN) were the environmental variables most significantly related with genetic data.
