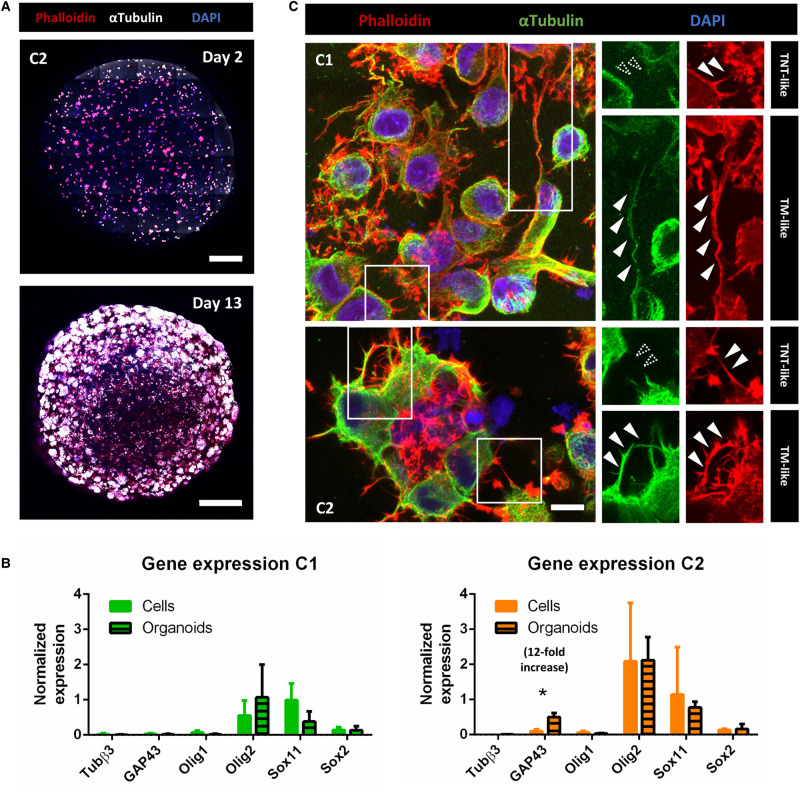
Figure 3. GSLCs in tumor organoids.
(A) Images of C2 tumor organoids at 2 and 13 days of growth using Pln-Apo 10×/0.45 objective of inverted confocal LSM700. The resulting images represent a max intensity projection of 5 and 31 sections (step size: 7 and 3.12 µm), respectively, stained for anti-αTubulin (microtubules, white), Phalloidin (actin in red) and nuclei (blue). Scale bars are 200 (top) and 500 µm (bottom). (B) Expression of differentiation and progenitor/stem cells markers in C1 and C2 organoids, respectively in green and orange. The relative gene expressions were quantified by RT-qPCR after RNA extraction from 23-days-old organoids, normalized over the expression of HPRT. Note the 12-fold increased expression of GAP43 in C2 tumor organoids, and GFAP and CHI3L1 show no expression in both conditions and are not represented on the graph. The graphs represent means with SD of three and four independent experiments for C1 and C2 respectively, each point performed in triplicate. Holm–Sidak method was applied to determine statistical significance between cells and organoids for each gene. P value <0.05 (*), P values >0.05 are not significant and not indicated on the figure. (C) C1 and C2 tumor organoids at 9 and 6 days, respectively, stained for anti-αTubulin (microtubules, green), Phalloidin (actin filaments, red), and nuclei (blue). Confocal images were acquired with 40× objective. Regions of interest show either αTubulin-devoid connections, defined as TNT-like (<1 µm), or thick αTubulin-positive connections (>1 µm), named TM-like. Dashed arrowheads indicate absence of fluorescent signal at the connection level, white-filled arrowhead show positiveness to the signal. Both images are max intensity projections of 12 slices (step size: 0.38 µm). Scale bar = 10 µm.

