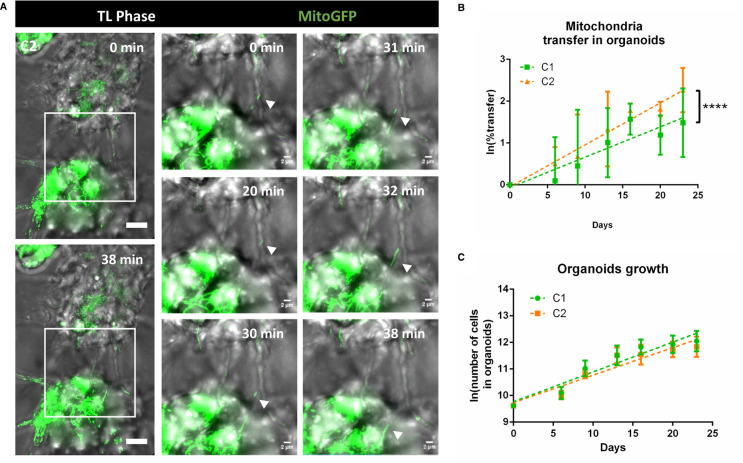
Figure 4. Mitochondria transfer in tumor organoids.
(A) TNT-like connection between C2 cells containing mitochondria in 6-days old tumor organoids. Timeframes result of the max projection of 62 slides (step size: 0.5 µm) with a total physical thickness of 31 µm, with 1 minute of interval time. White arrows point to the mitochondria movement inside the TNT at the different time points. Video were acquired using Bright field and laser 488 in a Spinning Disk microscope. (B) Quantification of the mitochondria transfer in tumor organoids over time in C1 and C2, respectively in green and orange. Organoids were prepared mixing donor and acceptor cells for each GSLC. For each timepoint and condition, duplicates of a pool of three organoids were dissociated in a single cell suspension and fixed for flow cytometry analysis after 6, 9, 13, 16, 20 and 23 days of culture. All the cells in the suspension were analyzed to obtain the percentage of acceptor cells receiving mitochondria. C1: day 6 1.54 ± 1.4%; day 9 2.80 ± 2.9%; day 13 2.20 ± 1.1%; day 16 5.07 ± 2.06%; day 20 3.55 ± 1.5%; day 23 3.05 ± 0.84% (four independent experiments). C2: day 6 1.72 ± 0.7%; day 9 2.64 ± 2.2%; day 13 4.96 ± 4.35%; day 16 5.98 ± 1.02%; day 20 5.57 ± 0.03%; day 23 8.37 ± 2.7% (three independent experiments). Percentage of transfer was transformed into a logarithmic scale. Error bar = SD. P-values are deduced by comparing the slopes of the two cellular population in a logistic regression model as described in material and methods. P value <0.0001 (****) (C) Cell number in tumor organoids. For each timepoint and condition, duplicates of a pool of three organoids were dissociated in a single cell suspension C1: day 6 24 800 ± 5768; day 9 63 150 ± 18 350; day 13 105 850 ± 43 970; day 16 140 450 ± 33 929; day 20 158 600 ± 60 394 day 23 181 800 ± 78 820 (four independent experiments). C2: day 6 22 600 ± 3704; day 9 49 700 ± 8116; day 13 104 200 ± 33 870; day 16 108 580 ± 42 218; day 20 128 800 ± 34 478; day 23 145 080 ± 47 726 (four independent experiments). The cell number was transformed into a logarithmic scale and slopes were compared by linear regression (dashed lines). No significant difference was observed between C1 and C2.

