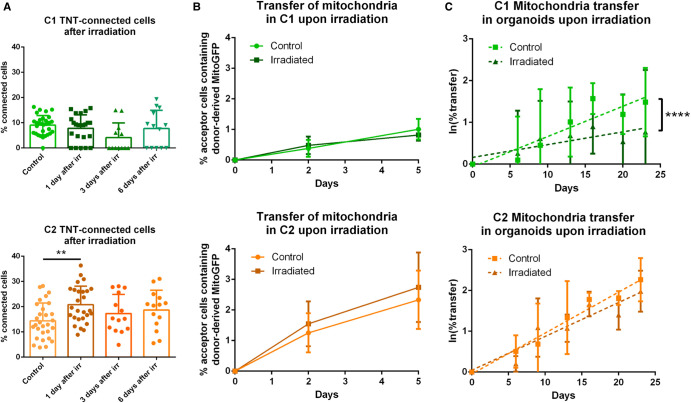
Figure 6. Effect of GSLC irradiation on TNT-based communication.
(A) Quantification of TNT- connected cells in C1 and C2 after irradiation, respectively in green and orange, in adherent cell culture. GSLCs were irradiated 1 day before cell plating on laminin-coated surface, then fixed after 6 h and stained with WGA. 2 × 2 tiles images were acquired with 60× objective and analyzed by Icy software, experimental duplicates were performed for each condition. The graphs represent means with SD. C1 were forming 7.8 ± 5% (four independent experiments, tot n cells counted = 891), 4.1 ± 6% (three independent experiments, total n cells counted = 300) and 7.7 ± 7% (three independent experiments, total n cells counted = 313) of connecting cells after 1, 3 and 6 days from the irradiation, respectively. No statistically significant difference was observed compared with control (9.0 ± 4%, five independent experiments, total n cells counted = 1239). C2 were forming 20.8 ± 7% (four independent experiments, total n cells counted = 1368), 17.3 ± 7% (three independent experiments, total n cell counted = 552) and 18.7 ± 8% (three independent experiments, total n cells counted = 462) of connecting cells after 1, 3 and 6 days from the irradiation, respectively. A statistically significant increase was observed 1 day after irradiation compared with control (14.4 ± 7%, four independent experiments, total n cells counted = 1367, P = 0.0073 (**)). Each dot represents an image containing an average of 40 cells each. P-values were deduced from contrast comparing the two cell populations in a logistic regression model. (B) Quantification of the mitochondria transfer by flow cytometry in both GSLCs over time in C1 and C2 upon irradiation, respectively in green and orange. Donor GSLC were irradiated 1 day before the co-culture, analysis was performed after 2 or 5 days (corresponding at 3 and 6 days from the irradiation). A minimum of 10 000 events were analyzed per condition, each performed in duplicate. In irradiated condition, C1 show 0.48 ± 0.28% and 0.81 ± 0.18% of acceptor cells receiving mitochondria after 2 and 5 days, respectively (four independent experiments). No statistically significant difference was observed compared with control (day 2: 0.38 ± 0.27%; day 5 1.01 ± 0.33%; four independent experiments). In irradiated condition, C2 show 1.54 ± 0.73% and 2.74 ± 1.13% of acceptor cells receiving mitochondria after 2 and 5 days, respectively (five independent experiments). No statistically significant difference was observed compared with control (day 2: 1.25 ± 0.63%; day 5: 2.33 ± 0.95%. Five independent experiments). P-values were deduced from contrast comparing the two cell populations in a logistic regression model. Graphs are means with SD. (C) Quantification of the mitochondria transfer in tumor organoids upon irradiation in C1 and C2, respectively in green and orange. Organoids were prepared mixing donor and acceptor cells for each GSLC and irradiated at 5 days from their preparation. Experiment was performed as in Figure 4D. Control C1: day 6 1.54 ± 1.4%; day 9 2.80 ± 2.9%; day 13 2.20 ± 1.1%; day 16 5.07 ± 2.06%; day 20 3.55 ± 1.5%; day 23 3.05 ± 0.84%. Irradiated C1: day 6 1.90 ± 1.6%; day 9 4.45 ± 1.9%; day 13 2.50 ± 1.7%; day 16 2.82 ± 1.5%; day 20 2.39 ± 1.61%; day 23 1.76 ± 1.2% (four independent experiments, P < 0.0001, ****). Control C2: day 6 1.72 ± 0.7%; day 9 2.64 ± 2.2%; day 13 4.96 ± 4.35%; day 16 5.98 ± 1.02%; day 20 5.57 ± 0.03%; day 23 8.37 ± 2.7%. Irradiated C2: day 6 1.23 ± 0.2%; day 9 3.50 ± 2.3%; day 13 3.03 ± 0.9%; day 16 5.46 ± 1.5%; day 20 4.23 ± 1.3%; day 23 7.21 ± 1.7% (three independent experiments, P = 0.0665). Percentage of transfer was transformed into a logarithmic scale. P-values are deduced by comparing the slopes of the two cellular population in a logistic regression model as described in material and methods. Error bar = SD.

