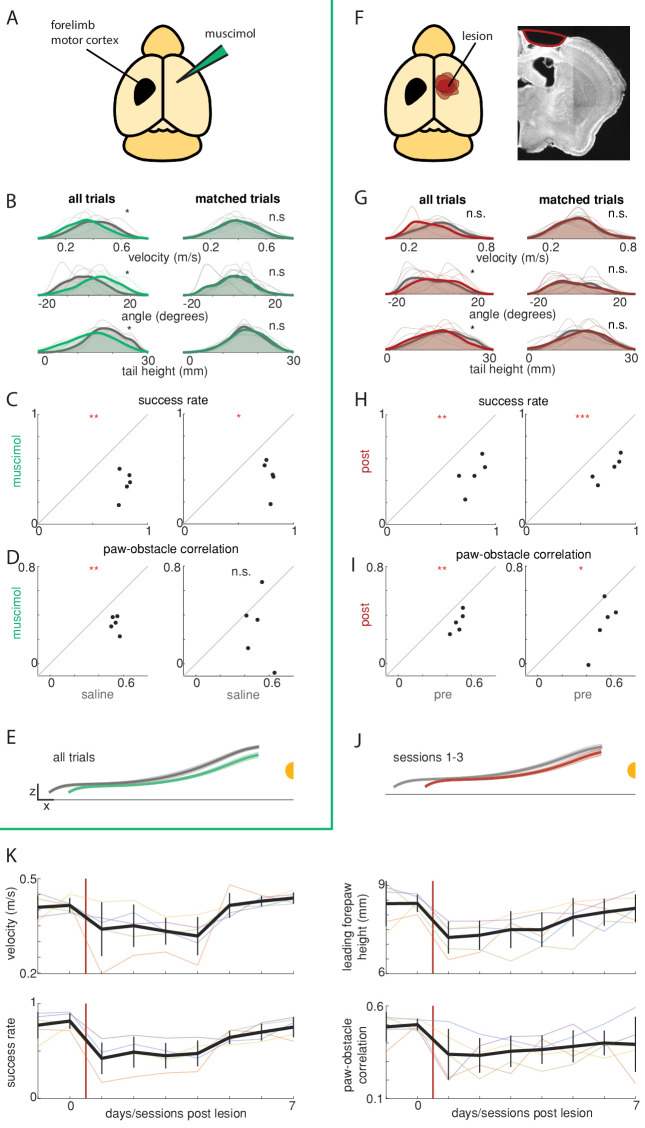
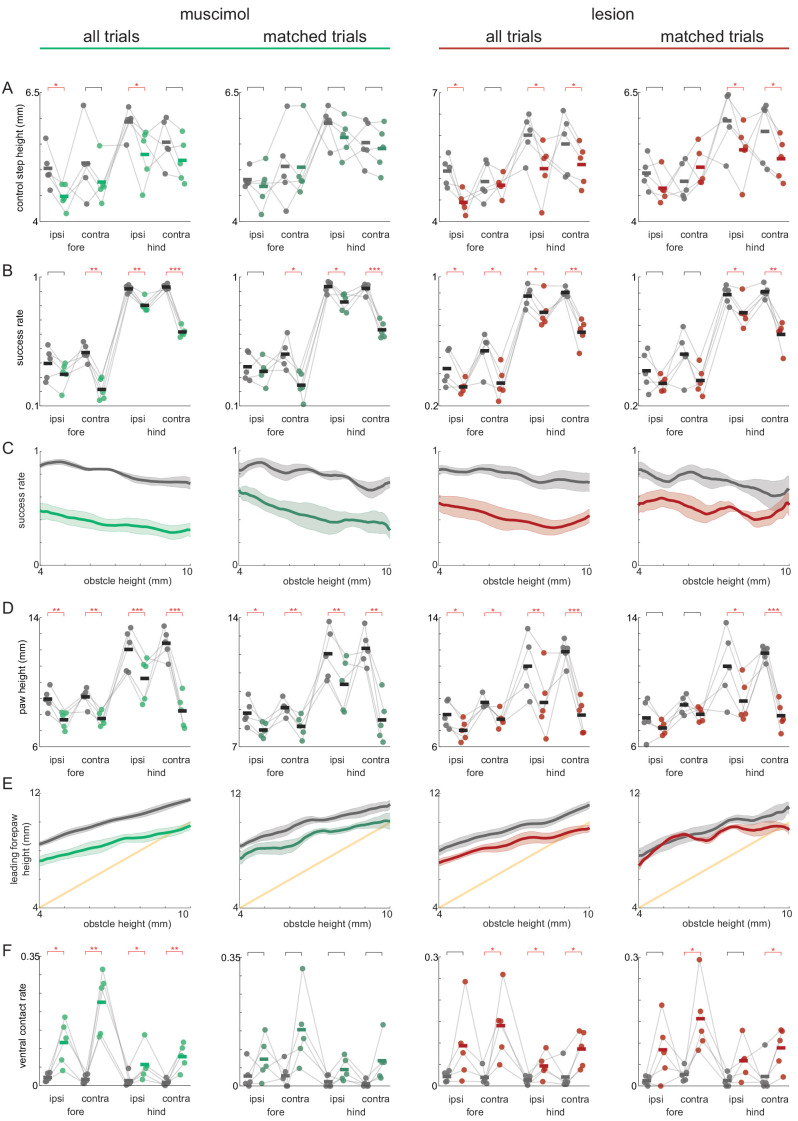
Figure 5. Obstacle avoidance affected by motor cortex manipulations.
(A–E) Unilateral muscimol injections affect basic characteristics of locomotion as well as obstacle avoidance (n = 5). Left column shows all trials and right column shows 20% of trials selected that are best matched for characteristics of basic locomotion. (B) Distributions for running velocity, body angle, and tail height are matched in the subpopulation of trials. Thin lines show distributions for each mouse in muscimol (green) and saline (gray) conditions. Thick lines show the average distributions across mice, which are very similar following the matching procedure. (C) Mice clear the obstacle at lower rates following muscimol injections (left), even after controlling for changes in locomotion (right). (D) The correlation between the height of the leading forepaw and that of the obstacle decreases following muscimol injection (left), although the difference is no longer significant among matched trials (right). (E) Kinematics of the leading forepaw as it approaches the obstacle for muscimol (green) and saline (gray) sessions. Paw heights were lower following muscimol injections. Shaded area is standard deviation across mice, and thick lines show the average across individual mouse averages. (F) Schematic showing locations of forelimb motor cortex lesions for all mice (n = 5) and an example coronal section for one mouse. (G-J) Like B-E, but comparing performance before and after unilateral motor cortex lesions. ‘Post’ condition shows average performance 1–3 days following the lesion (prior to recovery). Effects on success rates and paw-obstacle correlations persisted in matched trials. (K) Performance recovery over time. Thick black lines show the average across mice, vertical black lines show standard deviation, and thin lines show per-mouse averages. See also Figure 5—figure supplement 1.


