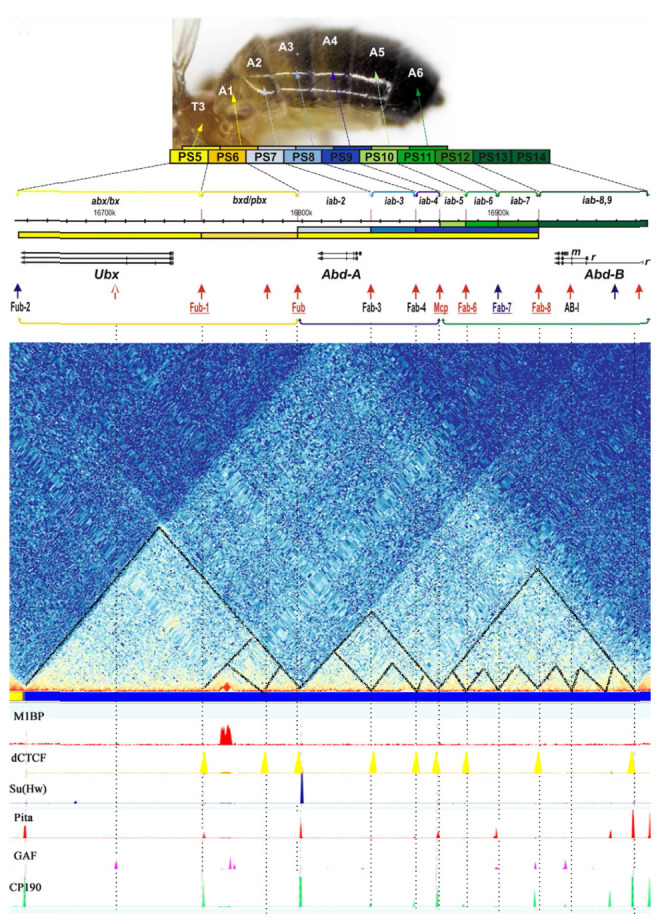
Fig. 8.

Schematic representation of BX-C. The BX-C map and coordinates are taken from the FlyBase resource (R6.04). The colored rectangles represent the embryonic parasegments (PS) corresponding to the imago segments. The regulatory regions controlling the expression of the Ubx, abd-A, and Abd-B genes (horizontal arrows) in each PS are indicated with upper brackets. The regulatory regions are organized into three transcriptionally associated regions indicated with lower brackets. The pattern and expression level of each gene are designated by colored scale; the darker color indicates higher expression levels. BX-C insulators are indicated with arrows: red arrows denote the CTCF-dependent ones; blue arrows denote the CTCF-independent ones [223]. The distribution map of TADs and some insulator/ architectural proteins in BX-C was constructed using the Chorogtnome Navigator dm3 resource [212]
