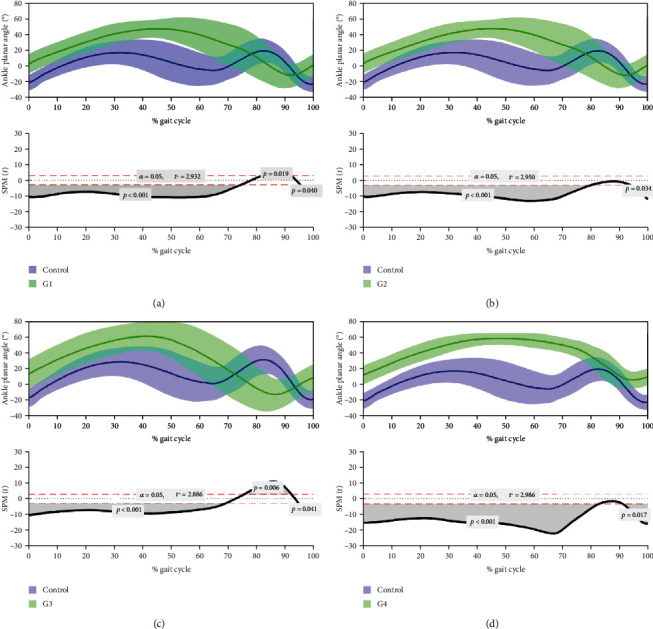
Figure 14.

Kinematic evaluation of rats 20 weeks after neurotmesis: (a) R; (b) EtER; (c) ROM; (d) EtEROM. Upper graphs show the mean θ° during UC gait (blue) versus the pattern of experimental groups (green) at the level of the ankle joint. Lower graphs show SPM statistic as a function of the gait cycle. SPM unpaired t-tests were performed, comparing the mean kinematic angle of each pattern to the respective mean kinematic angle of UC (α = 0.05). The moments of the gait cycle in which the critical threshold (t∗) was exceeded (corresponding to the moment when the θ° of the experimental groups is superior to the θ° of UC) are represented by the grey area of the lower graphs. G1 = R; G2 = EtER; G3 = ROM; G4 = EtEROM; SPM: statistical parametric mapping.
