
Figure 18.
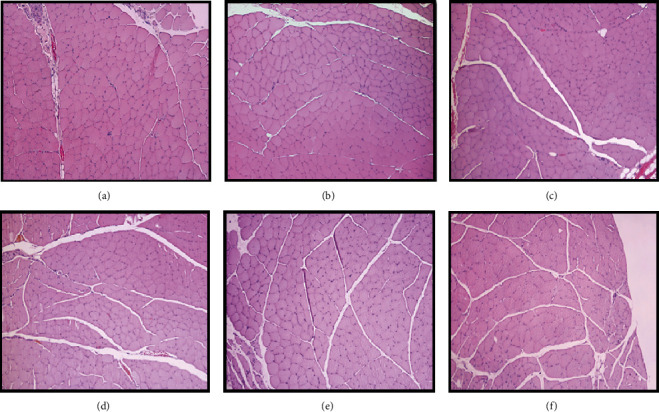
Histological images of the cranial tibial muscles subjected to histomorphometric analysis in the different groups: (a) UC; (b) EtE; (c) R; (d) EtER; (e) ROM; (f) EtEROM. H&E, magnifications: 100x.
Official websites use .gov
A
.gov website belongs to an official
government organization in the United States.
Secure .gov websites use HTTPS
A lock (
) or https:// means you've safely
connected to the .gov website. Share sensitive
information only on official, secure websites.
Histological images of the cranial tibial muscles subjected to histomorphometric analysis in the different groups: (a) UC; (b) EtE; (c) R; (d) EtER; (e) ROM; (f) EtEROM. H&E, magnifications: 100x.