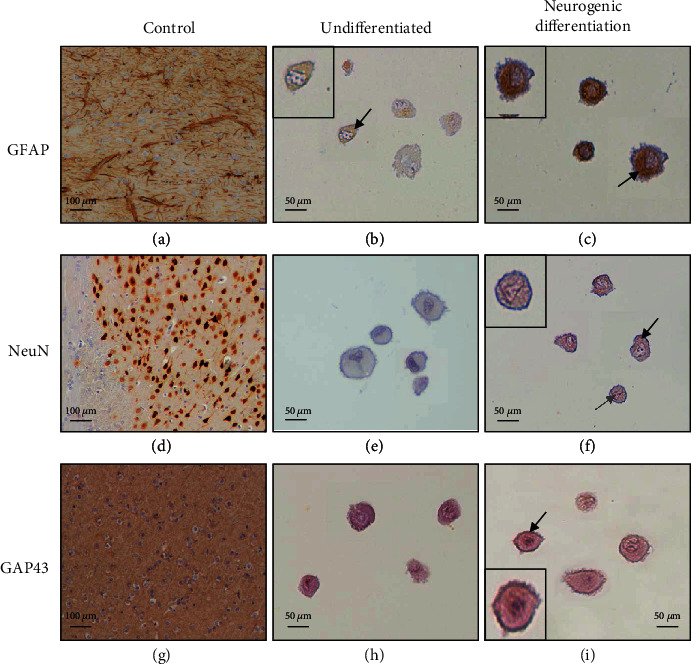
Figure 6.

Immunolabeling of rat brain tissue (control) and of undifferentiated and differentiated OM-MSCs (P6). Magnifications: 100x (control) and 400x (OM-MSCs): (a) positive immunoexpression of the intermediate filaments of the astroglial cells; (b) (+) the black arrow highlights weak cytoplasm immunoreactivity; (c) (+++) the black arrow highlights strong cytoplasm immunoreactivity; (d) positive immunoexpression of neuronal nuclei; (e (0), f (+)) the black arrow highlights weak cytoplasm immunoreactivity; the grey arrow also highlights nuclear immunopositivity; (g) positive neuronal membrane and periplasmic immunoreactivity; (h (0), i (++)) the black arrow highlights moderate membranous immunoreactivity. The inserts highlight the immunoexpression of each marker.
