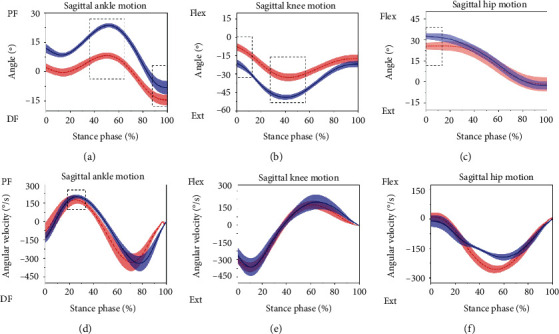
Figure 4.

Sagittal ankle, knee, and hip joint kinematics for novice runners (the solid blue line is the mean and the shaded area is the standard deviation) and experienced runners (dashed red line is the mean). Note: the dotted box indicates a significant difference between the two groups of runners, p < 0.05.
