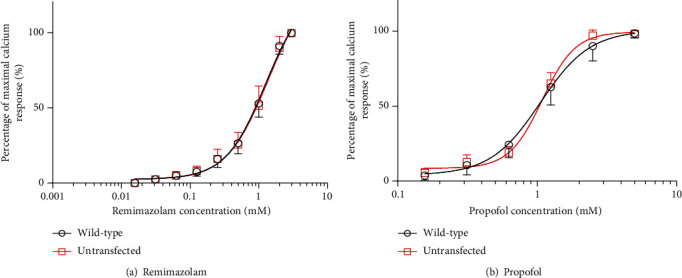
Figure 5.

Remimazolam and propofol concentration-dependent Ca2+ release by human embryonic kidney- (HEK-) 293 cells transfected with or without wild-type ryanodine receptor 1 (RYR1). Remimazolam and propofol concentration-response curves of RYR1-untransfected cells and wild-type RYR1-transfected cells are shown. Data were normalized to the maximal response of each cell type. The vertical axis represents percentage maximal Ca2+ response, and the horizontal axis represents remimazolam or propofol concentration (mM). Data are means ± SD in nontransfected and wild-type RYR1. Circles and squares represent wild-type RYR1 and untransfected groups, respectively. Dose-response curves of (a) remimazolam and (b) propofol. Curves showed no significant leftward shift in wild-type RYR1-transfected cells compared to untransfected RYR1 cells.
