Figure 1.

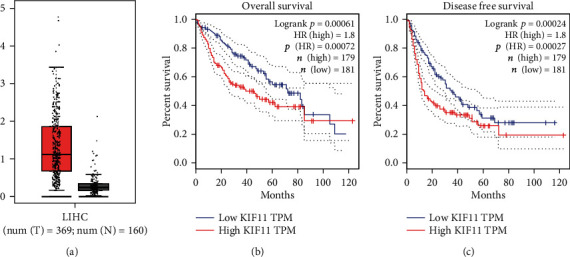
KIF11 expression and the correlation with the prognosis in TCGA database. (a) KIF11 expression levels between HCC tissues (n = 369) and normal liver tissues (n = 160) in TCGA database. (b) Overall survival (OS) and disease-free survival (DFS) of patients with different expression levels of KIF11. The OS and DFS were analyzed using the GEPIA web tool.
