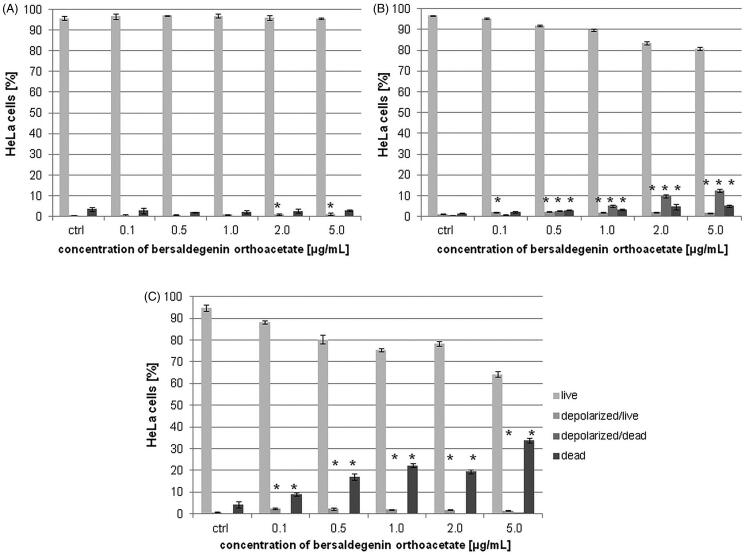
Figure 5.
The effect of bersaldegenin-1,3,5-orthoacetate on MMP in HeLa cells. The cells were treated with the compound at concentrations 0.1–5.0 µg/mL and DMSO (a control sample). After 3 h (A), 24 h (B), and 48 h (C) the cells were stained and analysed by flow cytometry. The percentage of live, depolarized/live, depolarized/dead and dead cells was determined in comparison to the control sample. Each sample was run in triplicate. Error bars represent standard deviations. Significant differences relative to the control are marked with an asterisk ‘*’ (p < 0.05).

