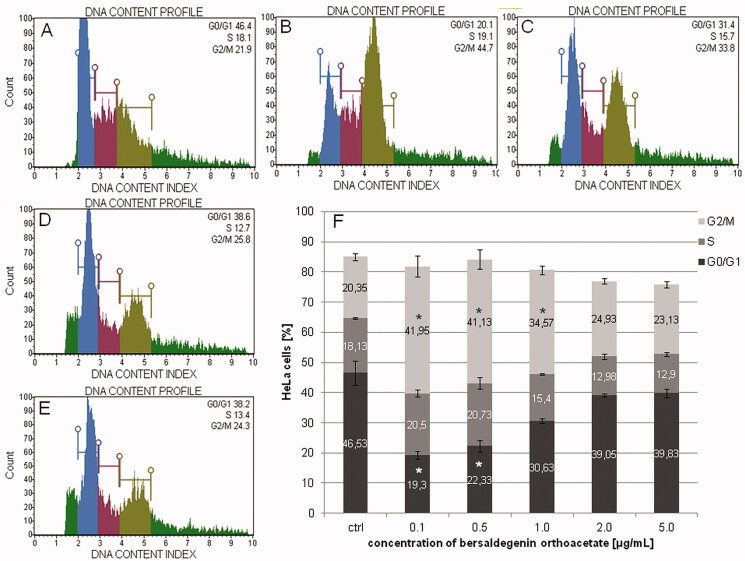
Figure 10.
The effect of bersaldegenin-1,3,5-orthoacetate on cell cycle in HeLa cells after 48 h of treatment. The cells were treated with DMSO (A) and the compound at concentrations of 0.1-5.0 μg/mL (0.5 (B), 1.0 (C), 2.0 (D), and 5.0 µg/mL (E), respectively) and analysed by flow cytometry. The percentage of the cells in each phase was determined in comparison to the control (0.25% DMSO) (F). The experiment was repeated three times, independently. Error bars represent standard deviations. Significant differences relative to the control are marked with an asterisk ‘*’ (p < 0.05).

