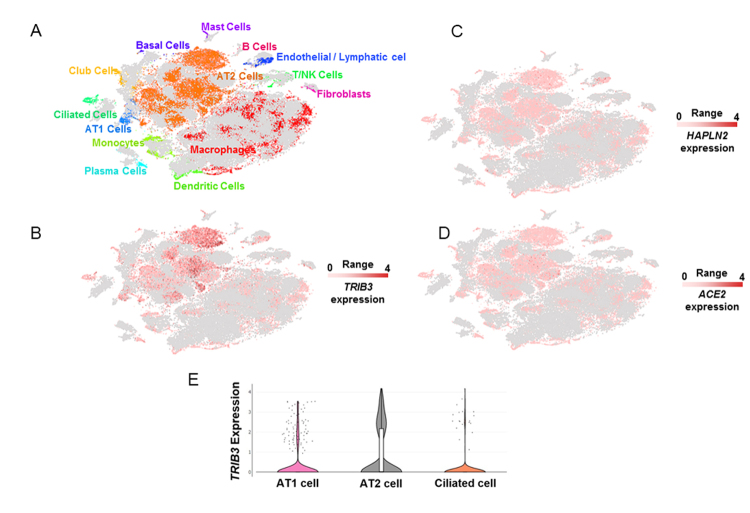
Figure 2.
Single-cell gene expression analyses of TRIB3, HAPLN2, and ACE2 in lung cells. (A) Unsupervised clustering demonstrates different cell populations identified in non-diseased lung human samples in a t-distributed Stochastic Neighbor Embedding (tSNE) plot, as described previously [25]. Grey dots represent single cells from pulmonary fibrosis samples that were not included in the present analysis. Single-cell gene expression of TRIB3 (B), HAPLN2 (C), and ACE2 (D) in different lung cell populations. The images were generated using the dataset [25], available at nupulmonary.org/resources/. The range represents the minimum and maximum expression. (E) Violin plots of TRIB3 expression levels in lung single-cells.

