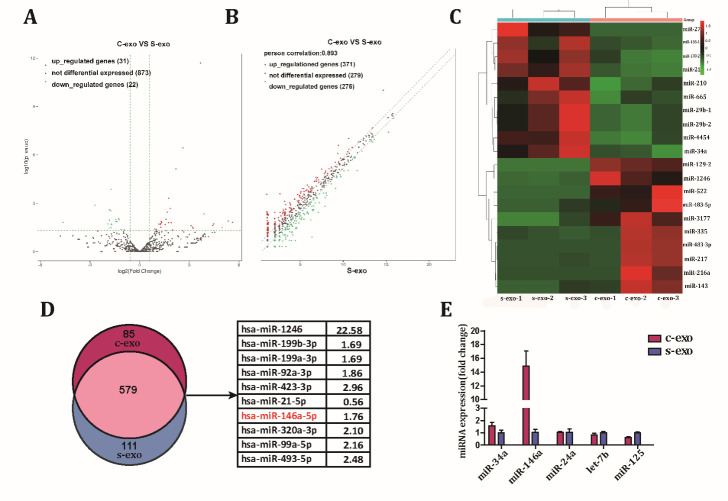
Figure 5.
Different miRNA expression patterns between c-exo and s-exo. (A) A volcano plot of miRNAs expressed in c-exo and s-exo. (B) A scatter plot of differences in miRNA expression between c-exo and s-exo. (C) The top 10 up- and down-regulated miRNAs in c-exo and s-exo. (D) A Venn diagram showing the number of miRNAs identified in c-exo and s-exo. Of the 579 miRNAs commonly expressed by both c-exo and s-exo, the top 10 up-regulated miRNAs in c-exo compared with s-exo were selected (as indicated in the table). (E) Selected miRNAs associated with angiogenesis were analyzed by Q-PCR.

