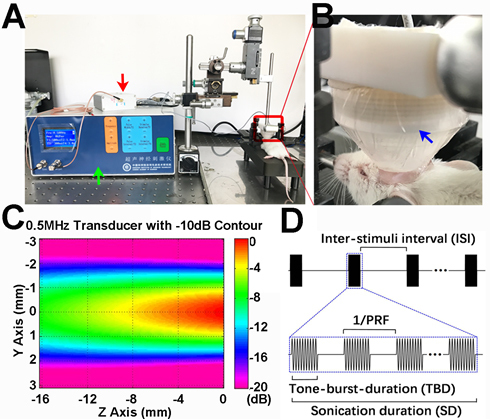
Figure 2.

The setup used for low frequency transcranial ultrasound stimulation of the ischemic hemisphere of mice A) Photograph showed the experimental setup of ultrasound stimulation device. B) Photograph showed the tFUS process. The transducer was located on the ipsilateral hemisphere of the mouse brain. C) The photograph showed the ultrasound intensity distribution field relative to the spatial peak in the sanitation region. The Z axis represented the stimulus depth. The Y axis showed the stimulus width. Different colors represented different relative tFUS intensities. Red (high intensity); violet (low intensity). D) The photograph showed a general view of the tFUS sequences: 0.5 ms tone-burst-duration (TBD), 1000 Hz pulse repetition frequency (PRF), 300 ms sonication duration (SD), and 2.7 s inter-stimuli interval (ISI). Green, red and blue arrows indicate the portable tFUS system, the impedance matching device and the ultrasound transducer, respectively.
