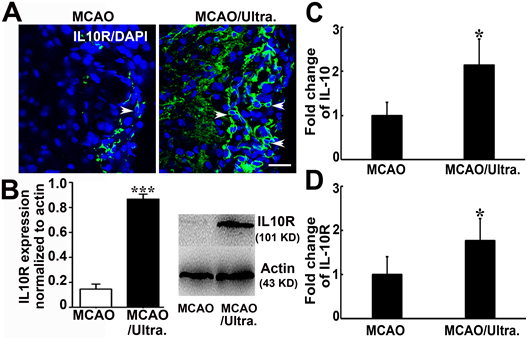
Figure 5.

Ultrasound stimulation of the brain upregulated IL-10R and IL-10 A) Photomicrographs showed IL-10R (green) and DAPI (blue) staining in the perifocal region of the ipsilateral hemisphere in sham, MCAO alone, and MCAO mice with tFUS. White arrowheads indicate that IL-10R is mainly expressed in the cell cytosol in the perifocal region in MCAO mice. IL-10R staining was greatly increased after tFUS. Scale bar= 25 μm. B) Western blot analysis showed that IL-10 expression (101 KD) was greatly increased after tFUS. The bar graph showed the quantitative data for the Western blot analysis. n=6 per group. *, p<0.05, tFUS treated mice after MCAO vs. MCAO alone. PCR showed the relative expression of IL-10 (C) and IL-10R (D) in the brain after tFUS treatment. n=6 per group. Data are presented as mean ± SD.*, p<0.05.
