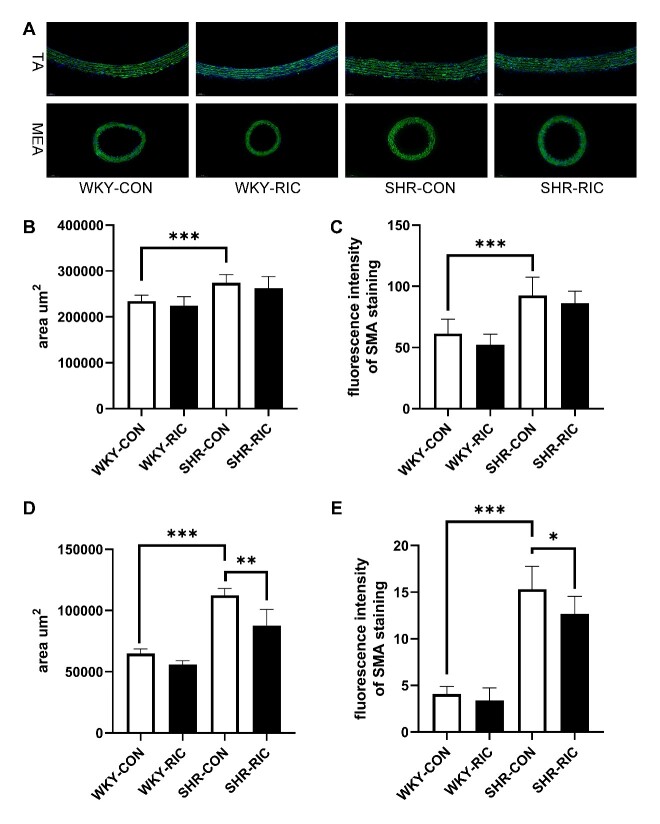
Figure 6.
LRIC suppressed smooth muscle cell hypertrophy of small resistance artery. (A) Immunostaining of smooth muscle actin of the TA and MEA. SMC area (B) and fluorescence intensity (C) in TA of each group. SMC area (D) and fluorescence intensity (E) in MEA of each group. Data are expressed as mean ± SD, * P<0.05, * * P<0.01, * * * P<0.001, WKY-CON vs. SHR-CON, SHR-CON vs. SHR-RIC. N = 5 each group.

