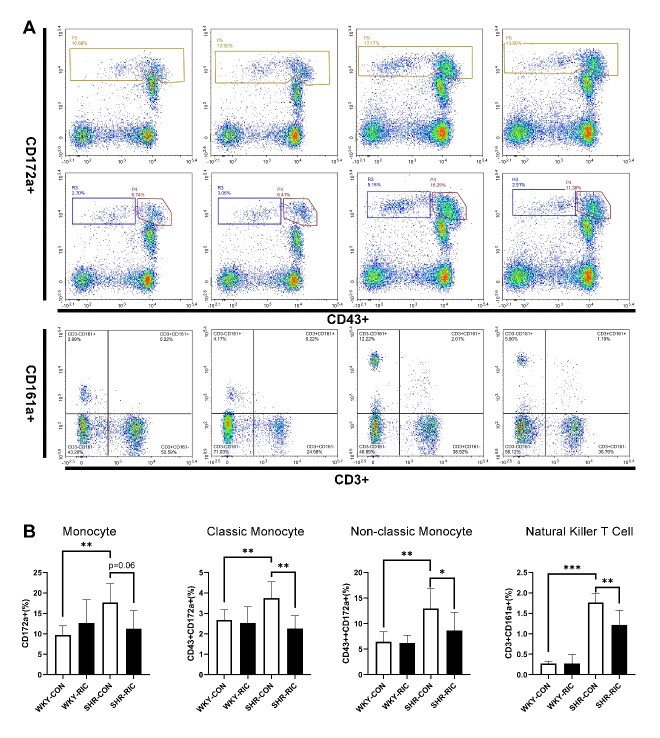
Figure 8.
LRIC treatment regulated inflammatory immunocytes in circulation. (A) Flow cytometry analysis of CD172a+, CD43+ 172a+, CD43++ 172a+, and CD3+CD161a+ cells in the circulation. (B) level of monocyte, classic monocyte, non-classic monocyte, and natural killer T cells in circulation of each group. Data are expressed as mean ± SD, * P<0.05, * * P<0.01, * * * P<0.001, WKY-CON vs. SHR-CON, SHR-CON vs. SHR-RIC. N = 5 each group.

