
Fig. 4.
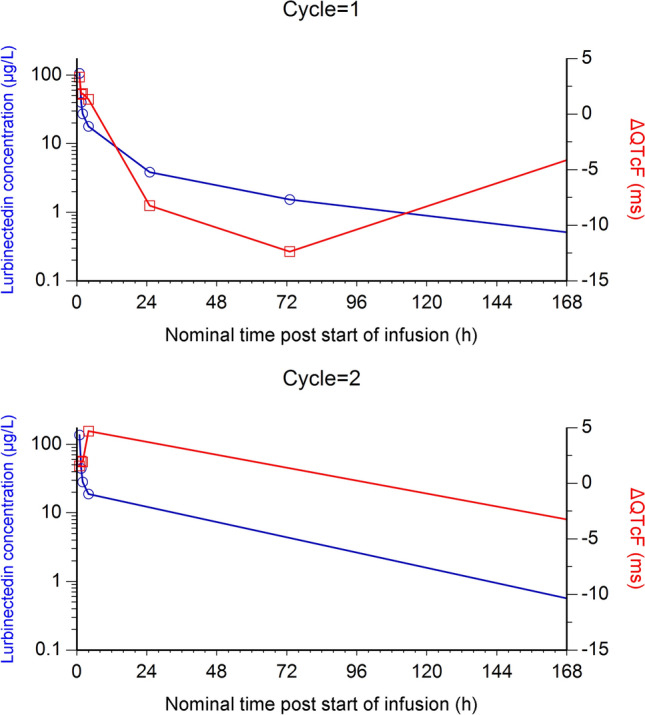
Mean ΔQTcF (red lines, right y-axis) and plasma observed lurbinectedin concentration (blue lines, left y-axis), by time point, in cycle 1 (upper panel) and cycle 2 (bottom panel)
Official websites use .gov
A
.gov website belongs to an official
government organization in the United States.
Secure .gov websites use HTTPS
A lock (
) or https:// means you've safely
connected to the .gov website. Share sensitive
information only on official, secure websites.
Mean ΔQTcF (red lines, right y-axis) and plasma observed lurbinectedin concentration (blue lines, left y-axis), by time point, in cycle 1 (upper panel) and cycle 2 (bottom panel)