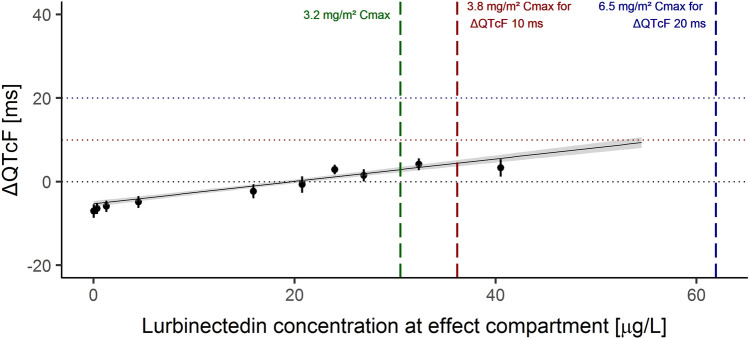
Fig. 5.
Change from baseline in Fridericia’s corrected QT (ΔQTcF) vs. lurbinectedin concentration at effect compartment. The observed ΔQTcF have been grouped into deciles of the predicted concentrations at effect compartment and the average observed ΔQTcF (black dots) have been plotted at the average predicted concentrations in each decile with two-sided 90% CI. Solid black line and grey area denote the model-predicted ΔQTcF with two-sided 90% confidence intervals (CI) as a function of lurbinectedin concentration at the effect compartment. Vertical dashed green, red, and blue lines indicate the maximum plasma concentration (Cmax) geometric mean of lurbinectedin associated with the 3.2 mg/m2 dose, Cmax geometric mean of lurbinectedin associated with the 3.8 mg/m2 dose at which upper bound of the two-sided 90% confidence interval of the ΔQTcF is 10 ms (red line), and Cmax geometric mean of lurbinectedin associated with the 6.5 mg/m2 dose at which upper bound of the two-sided 90% confidence interval of the ΔQTcF is 20 ms (blue line)

