Fig. 1.
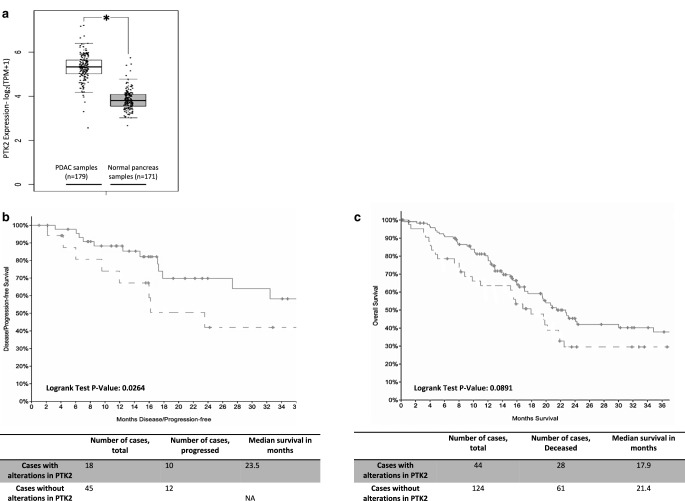
a Differential expression of PTK2 between PDAC samples from TCGA (white box, n = 179) and normal pancreatic tissue (grey box, n = 171) from GTEx, data were mined from GEPIA and shown as a box plot (t-test; *p < 0.05). b,c Survival data from PanCancer Atlas cohort shown as Kaplan–Meier survival curves, 3‑year progression-free survival (PFS, b) and 3‑year overall survival (c), in patients with PTK2 alterations; the dotted lines represent patients with any PTK2 alteration, and the solid lines represent patients without PTK2 alterations. Log rank-test significant in 3‑year PFS (p = 0.0264) and nonsignificant in the 3‑year overall survival (p = 0.089)

