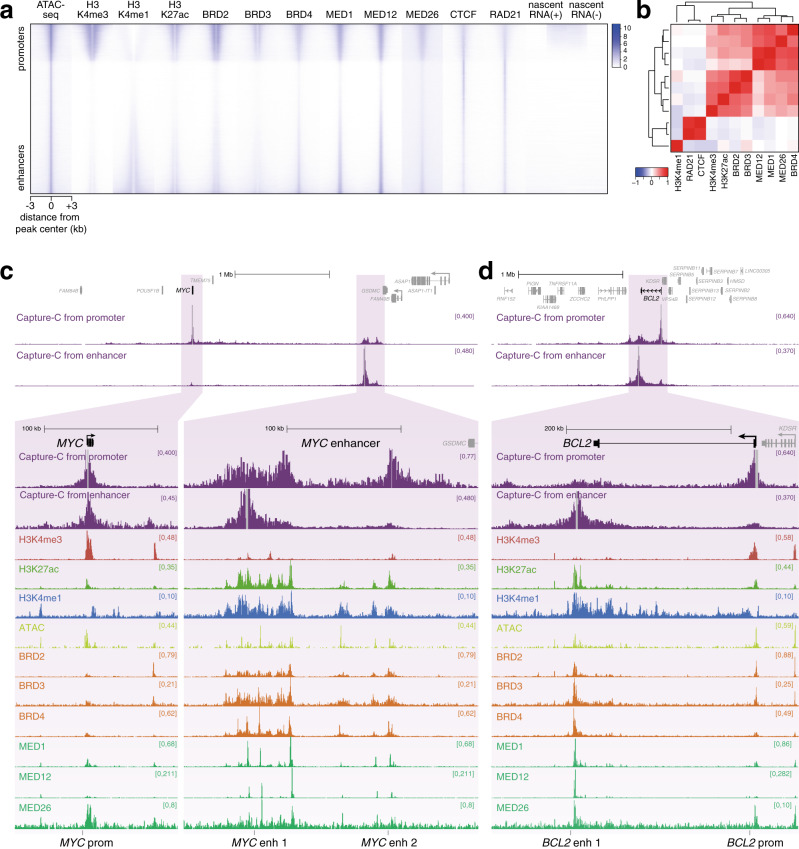
Fig. 1. BET proteins and Mediator are a key feature of enhancers.
a Heatmap comparing levels of histone modifications, chromatin proteins and stranded nascent RNA-seq at ATAC-seq peaks in SEM cells. Peaks are ranked based on the relative levels of H3K4me3 and H3K4me1, placing promoter-like ATAC-seq peaks towards the top and enhancer-like ATAC-seq peaks towards the bottom. b Pearson correlation coefficients for ChIP-seq data at ATAC-seq peaks shown in a. Dendrogram shows hierarchical clustering of datasets. Source data are provided as a Source Data file. c Capture-C, ChIP-seq and ATAC-seq at the MYC gene and enhancer region in SEM cells. Capture-C was conducted using the MYC promoter or enhancer region as the viewpoint, indicated by vertical gray bars, and is displayed as the mean of three biological replicates. Locations of primers used for BRD4/Mediator ChIP-qPCR are shown at the bottom of the figure. d Capture-C, ChIP-seq, and ATAC-seq data at BCL2, as in c.

