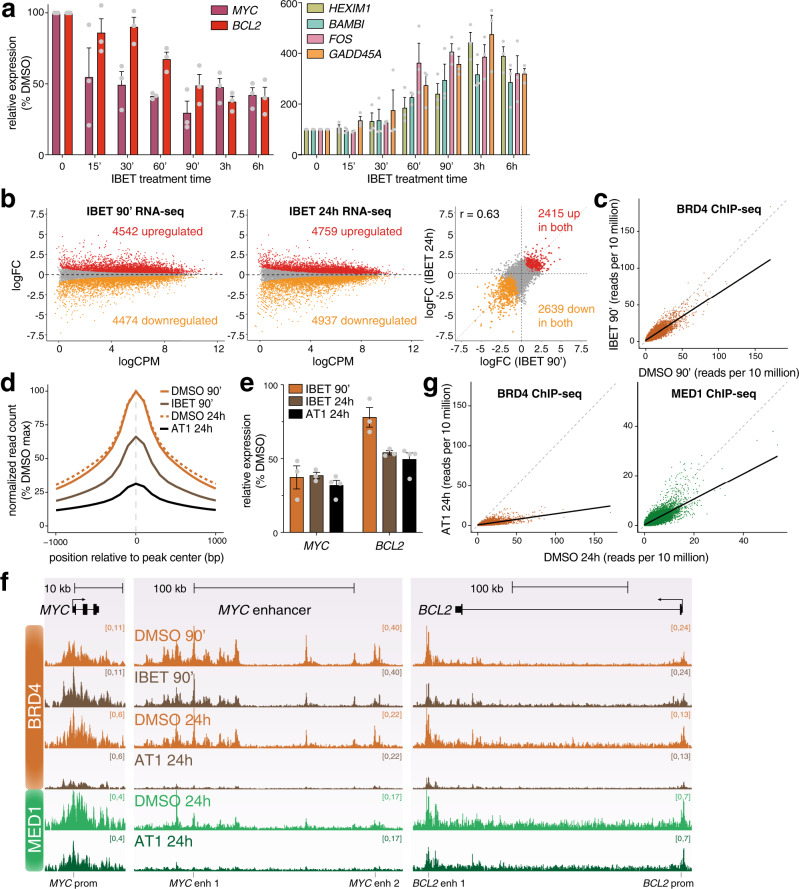
Fig. 2. IBET treatment results in large-scale transcriptional changes.
a Left: qRT-PCR analysis of gene expression following 1 µM IBET-151 treatment for the indicated times, using intronic PCR primers. Right: qRT-PCR analysis of gene expression using mature mRNA PCR primers. Values are normalized to YWHAZ mature mRNA levels, relative to DMSO treatment. Mean of three biological replicates; error bars show SEM. Source data are provided as a Source Data file. b MA plots for changes in nascent RNA levels following 90 min (left) or 24 h (middle) treatment with IBET. Right: correlation of log2 fold-change (logFC) of gene expression following IBET treatment for 90 min or 24 h. Statistically significant differences (red: increased; orange: decreased; gray: unchanged) from three biological replicates, FDR < 0.05. c Reference-normalized BRD4 ChIP-seq reads at BRD4 peaks from SEM cells treated with DMSO (x-axis) or IBET (y-axis) for 90 min. Solid line shows data trend (generalized additive model). d Metaplot of reference-normalized mean BRD4 levels at BRD4 peaks in SEM cells treated with DMSO (solid orange) or IBET (brown) for 90 min, or DMSO (dashed orange) or AT1 (black) for 24 h. Data are normalized to the peak DMSO read count for each treatment time. e qRT-PCR analysis of gene expression following IBET or AT1 treatment using mature mRNA PCR primers. Values are normalized to YWHAZ mature mRNA levels, relative to DMSO treatment. Mean of three (IBET treatments) or four (AT1 treatment) biological replicates; error bars show SEM. Source data are provided as a Source Data file. f Reference-normalized BRD4 and MED1 ChIP-seq at the MYC gene and enhancer and at BCL2. SEM cells were treated with DMSO or 1 µM IBET for 90 min, followed by BRD4 ChIP-seq, or with DMSO or 1 µM AT1 for 24 h, followed by BRD4 and MED1 ChIP-seq. g Reference-normalized BRD4 (orange) and MED1 (green) ChIP-seq reads at BRD4 peaks from SEM cells treated with DMSO (x-axis) or 1 µM AT1 (y-axis) for 24 h. Solid line shows data trend (generalized additive model).

