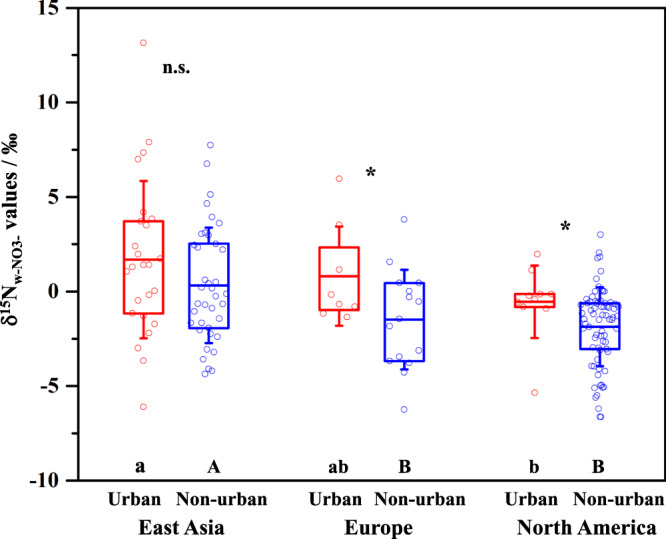
Fig. 2. δ15Nw-NO3− values at urban and non-urban sites of East Asia (n = 25 and n = 38, respectively), Europe (n = 8 and n = 15, respectively), and North America (n = 10 and n = 73, respectively).

Dots show mean values of replicate measurements at each site. The box encompasses the 25th−75th percentiles, whiskers, and line in each box are the SD and mean values, respectively. The symbol of * indicates differences between urban and non-urban sites. n.s.: not significant. Different letters indicate differences among East Asia, Europe, and North America. The significance level was set at P < 0.1.
