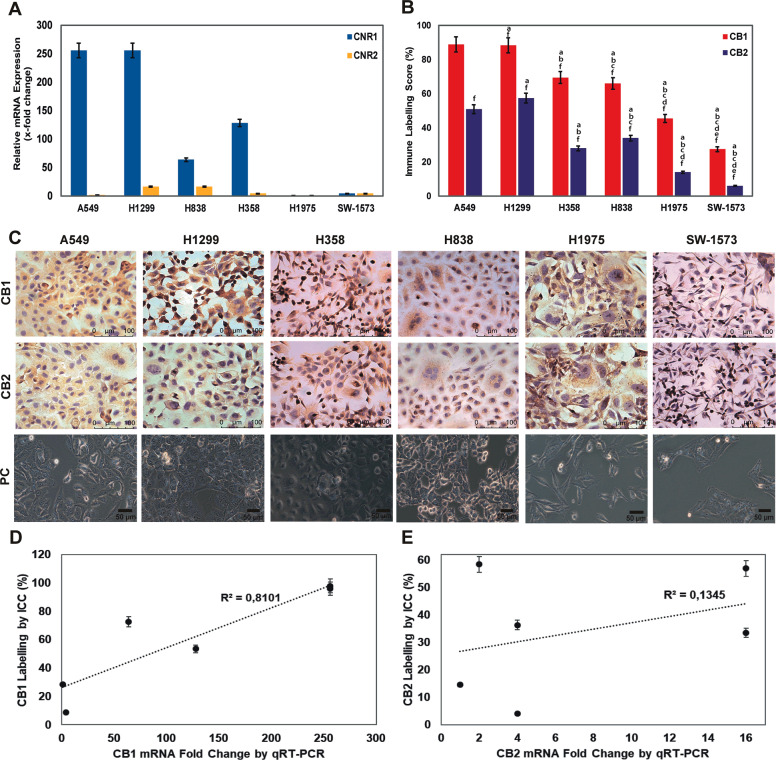
Fig. 1. NSCLC cell lines express CB1R.
a qRT-PCR analysis for relative mRNA fold change values of CB1R and CB2R genes relative to β-actin. The results are represented with 5% error. b Bar graph presenting the percentage of CB1 and CB2 indirect immune peroxidase-labeled cells with mean ± SEM, (n = 25), a, b, c, d, and e denote p < 0.05 comparing to A549, H1299, H358, H838, and H1975 cells respectively and f refers to p < 0.05 comparing CB2 to CB1 in each cell line, one-way analysis of variance (ANOVA). c Micrographs presenting CB1 and CB2 indirect immune peroxidase-labeled (scale bar, 100 µm) and phase-contrast (PC, scale bar, 50 µm) view of NSCLC A549, H1299, H358, H838, H1975, and SW-1573 cell lines, ×400. d, e Correlation graph of CB1 (d) and CB2 (e) receptor immune labeling and mRNA expression levels (correlation coefficient: R2, p = 0.024, and p = 0.824 respectively with Spearman’s test).

