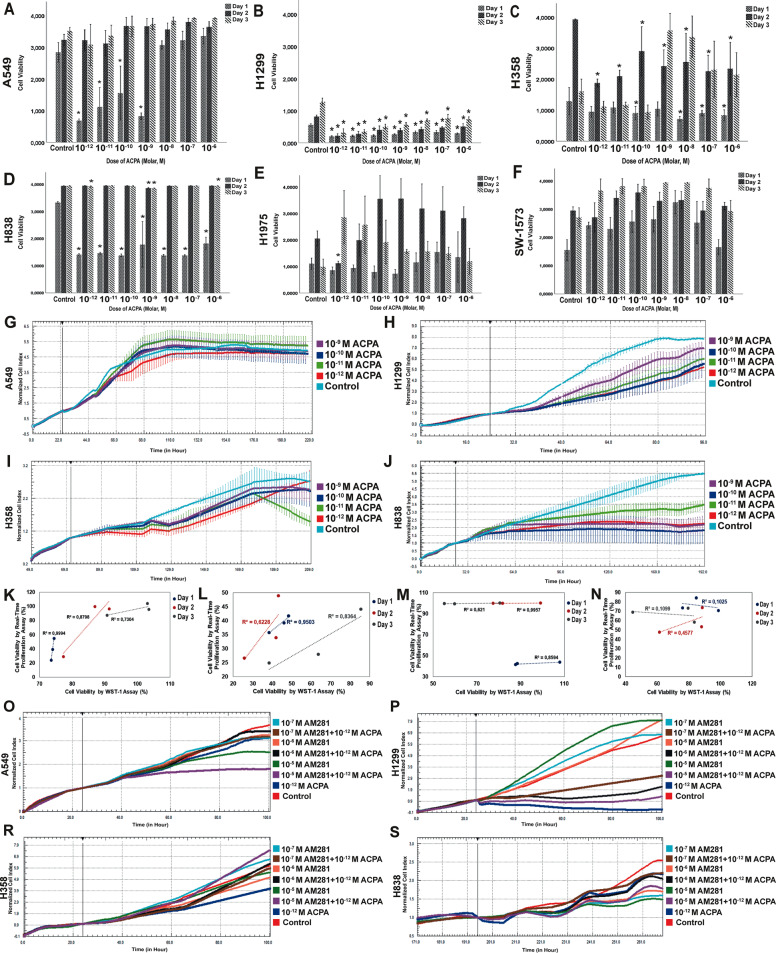
Fig. 2. ACPA presents antiproliferative effect on NSCLC cells.
Proliferation indices for (a) A549, (b) H1299, (c) H358, (d) H838, (e) H1975, and (f) SW-1573 cells by WST-1 presented with control and 10−6-10−12 M ACPA administered experiment groups from day 1 to 3 after treatment in mean ± SEM (n = 6, *p < 0.05 by one-way analysis of variance (ANOVA)). All proliferation data are shown in absorbance (A540 nm-A630 nm). Real-time proliferation indices of (g) A549, (h) H1299, (i) H358, and (j) H838 cells presented with control and 10−9-10−12 M ACPA administered experiment groups from 72 to 192 hours by xCELLigence (n = 3). Correlation graphs (k–n) present the relation between cell viability (%) by RTCA and WST-1 assay (correlation coefficient: R2, Spearman’s test). ACPA was applied at 10−12-10−10 M doses on (k) A549 (p = 0.015, p = 0.225 and p = 0.348 respectively), (l) H1299 (p = 0.143, p = 0.421 and p = 0.265 respectively), (m) H838 (p = 0.245, p = 0.042, and p = 0.422 respectively), and (n) H358 (p = 0.793, p = 0.527, and p = 0.785 respectively) cell lines. Real-time proliferation indices of (o) A549, (p) H1299, (r) H358, and (s) H838 cells with control, CB1 reverse agonist/antagonist AM281 and IC50 dose of ACPA administered groups for 74 hours by xCELLigence (n = 3).

