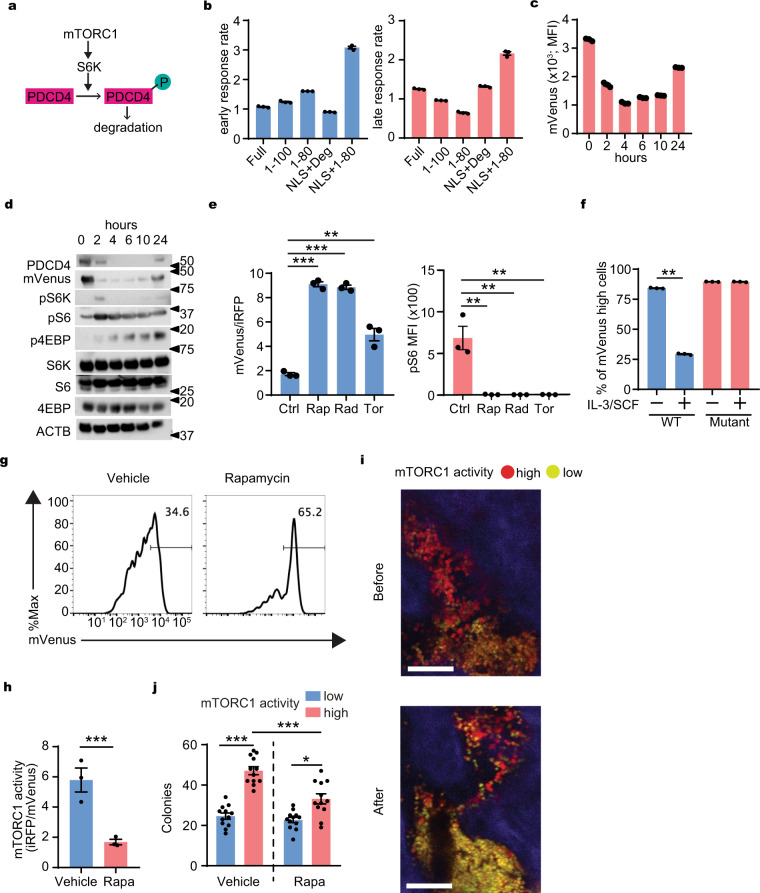
Fig. 1. Development of mTORC1 probe.
a A schematic model of PDCD4 degradation under mTORC1 signal. b Ratio (response rate) of the green fluorescence intensity of NIH3T3 cells transduced with mVenus fused to full length, partial fragments, or degron (Deg) fragment of PDCD4 with or without SV40NLS (Full, 1–100, 1–80, NLS + Deg, NLS + 1–80) at 2 h (early) and 4 h (late) after serum re-addition compare to the intensity at 0 h (n = 3). c Changes in intensity of mVenus-TOSI in NIH 3T3 at indicated times after serum readdition (n = 3). d Representative changes in abundance of PDCD4, mVenus-TOSI, and phosphorylation of mTORC1 targets at indicated times after serum re-addition in NIH 3T3. e The effect of mTORC1 inhibitors on mVenus intensity (left) and phosphor-S6 (right) in murine AML cells. Rapamaycin (Rap), Rad001 (Rad), Torin II (Tor) (n = 3). f Response of the mVenus probes with or without mutation in the phosphorylation sites of PDCD4 in murine AML cells (n = 3). g Representative histogram plot of mVenus intensity in AML cells harvested from mice treated with vehicle or rapamycin. h mTORC1 activity of harvested AML cells from mice with vehicle or rapamycin (Rapa) treatment (n = 3). i Representative images of in vivo imaging with a 2-photon microscope of the calvarial bone marrow before and 24 h after rapamycin treatment (4 mg/kg i.p.) from a similar visual field from same mouse. Red (mVenus−/TdTomato+): mTORC1 high cells, Yellow (mVenus+/TdTomato+): mTORC1 low cells. Scale bar = 100 μm. j Clone forming capacity of mTORC1 high and low cells harvested from the mice (described in g and h) treated with vehicle or rapamycin (Rapa) (n = 12). Mean ± SEM was shown in bar pot (each dot represents each sample). b–f Representative data from at least three independent experiments were shown. g–j Representative data from at least two independent experiments were shown. Statistical analysis was performed by using two-way t-test (f, h) or paired t-test (e, j) (*p < 0.05, **p < 0.01, ***p < 0.001).

