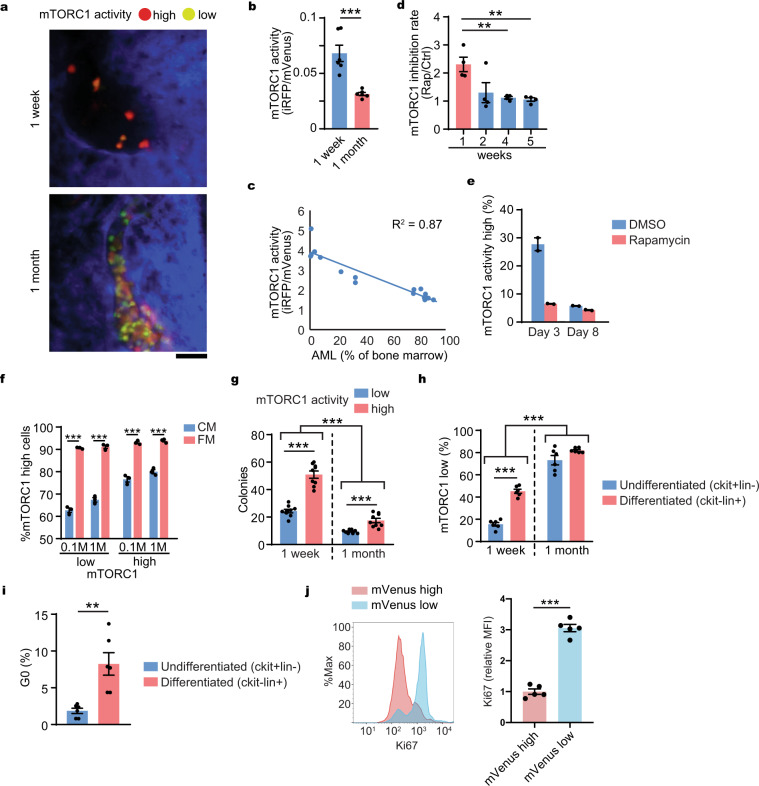
Fig. 2. mTORC1 activity is downregulated during AML progression.
a Representative in vivo imaging of AML cell with mVenus-TOSI probe (FM4-Venus-TdT) in the mouse calvarial bone marrow from a similar visual field of the same mouse using a confocal microscope during disease development at 1 week and 1 month after transplantation. Scale = 50 μm. Red (mVenus−/TdTomato+): mTORC1-high cells, Yellow-Green (mVenus+/TdTomato+): mTORC1-low cells. b Flow cytometry analysis of mVenus-TOSI probe intensity during disease development at 1 week and 1 month after transplantation. The AML cells were harvested from femurs of the mice (n = 6/time point). c Correlation between AML burden and mTORC1 activity in AML cells with mVenus-TOSI probe (FM4-Venus) (n = 16). d mTORC1 inhibition rate (mVenus intensity of AML cells from rapamycin treated mice/mVenus intensity of AML cells from vehicle treated mice) by a single rapamycin treatment (4 mg/kg i.p.) at different time points after transplantation. The AML cells were harvested from femurs of the mice (n = 4/time point/treatment). e mTORC1 activity in AML cells cultured in vitro obtained at indicated days after starting rapamycin treatment (n = 2). f Proportions of mTORC1-high cells cultured at high (1 M/ml) and low (0.1 M/ml) concentrations with after 24 h in conditioned medium (CM) or fresh medium (FM) (n = 3). g Colony-forming capacity of mVenus-low and high AML cells harvested at early (1 week) or late (1 month) time points after transplantation (n = 9). h Proportions of mTORC1-low cells in undifferentiated or differentiated AML cells at different time points after transplantation (n = 6). i Proportions of G0 phase (mVenus high population) of AML cells (FM4-mVenus-p27K−) in undifferentiated or differentiated AML cells after transplantation (n = 6). j Cell cycle analysis of AML cells 1 week after transplantation. Ki67 staining intensity of mVenus high or low cells were analyzed by flow cytometry (n = 5). a–j Representative data from at least two independent experiments were shown. Mean ± SEM was shown in bar pot (each dot represents each sample). Statistical analysis was performed by using two-way t-test (b, f, i, j) or paired t-test (d, g, h) (**p < 0.01, ***p < 0.001).

