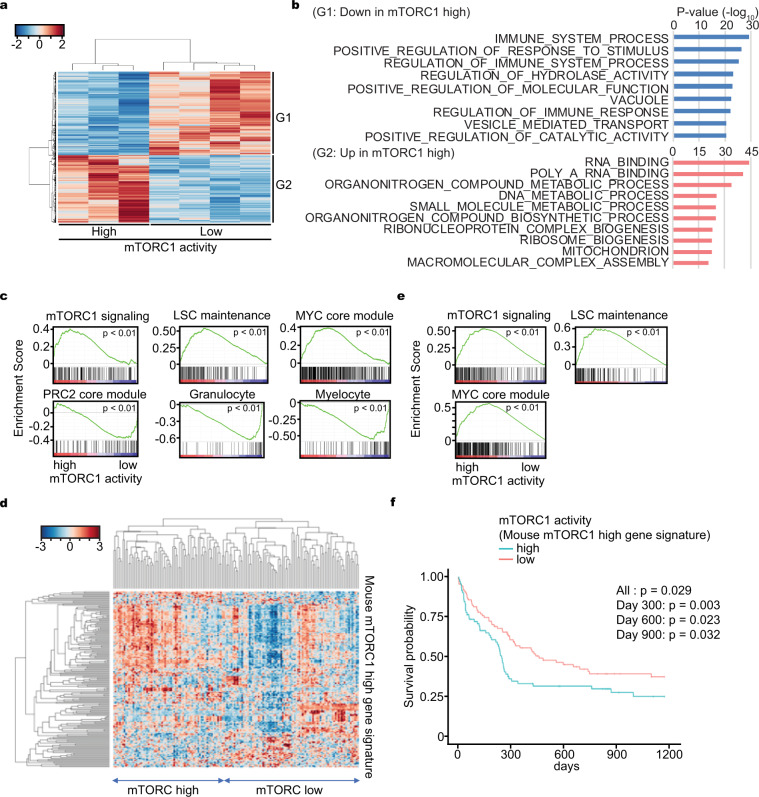
Fig. 3. Expression profiling between mTORC1 high and low AML cells.
a Clustering analysis of transcriptomic data obtained from mTORC1 high or low AML cells harvested from mouse bone marrow. b Gene ontology analysis of differentially expressed genes obtained from mTORC1 high or low AML cells harvested from mouse bone marrow. c Gene set enrichment analysis (GSEA) of differentially expressed genes obtained from mTORC1 high or low AML cells harvested from mouse bone marrow. d Classification of human AML samples (GSE12417) with the mouse mTORC1 high AML cell gene signature (mouse mTORC1 high gene signature). e GSEA of transcriptomic data (GSE12417) obtained from human AML samples classified according to their expression of the mouse mTORC1 high gene signature. f Overall survival probability of AML patients classified according to their expression of the mouse mTORC1 high gene signature. Overall log-rank test p-value (All) and the p-value at different time points (day 300, 600, and 900) were shown.

