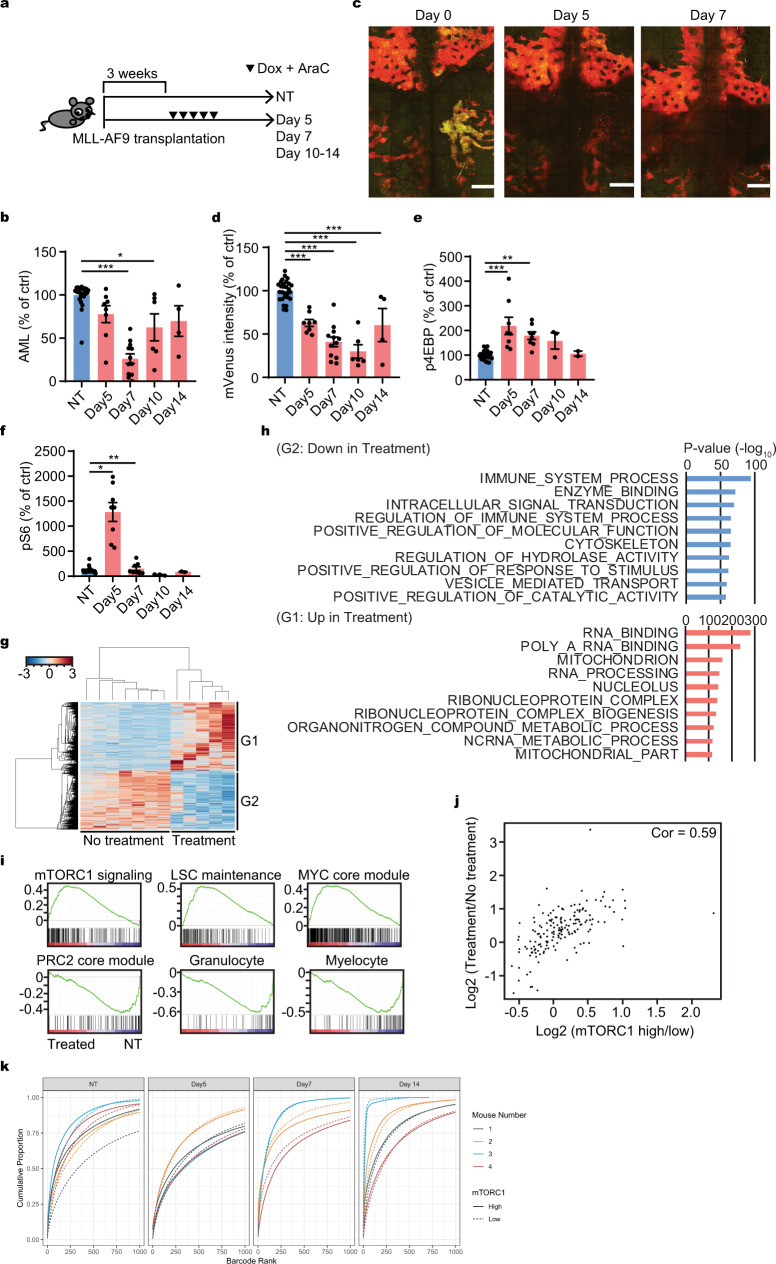
Fig. 4. mTORC1 activity dynamics during chemotherapy.
a Experimental workflow of bone marrow harvest in relationship to chemotherapy administration (day 0: first day of treatment). b Relative of AML burden without (NT) or after chemotherapy (day 5, 7, 10, and 14). The numbers were normalized to the values at NT (n = 28, 8, 12, 6, 4, respectively). c Representative intravital imaging of z-projection of the entire calvarial bone marrow with a 2-photon microscope of a FM4-Venus/TOSI transplanted mouse before (day 0) and after chemotherapy (day 5 and 7). Red (mVenus−/TdTomato+): mTORC1 high area, Yellow (mVenus+/TdTomato+): mTORC1 low area. Multiple z-projection images are stitched together to show a large area of the calvarial bone marrow. Scale = 500 μm. d Relative mVenus intensity by flow cytometry of FM4-mVenus-TOSI cells in murine recipient without (NT) or after chemotherapy (day 5, 7, 10, and 14). The numbers were normalized to the average value at NT (n = 28, 8, 12, 6, 4, respectively). e Relative p4EBP during chemotherapy without (NT) or after chemotherapy (day 5, 7, 10, and 14) by flow cytometry. The numbers were normalized to the average value at NT (n = 26, 8, 8, 3, 2, respectively). f Relative pS6 during chemotherapy without (NT) or after chemotherapy (day 5, 7, 10, and 14) by flow cytometry. The numbers were normalized to the average value at NT (n = 26, 8, 8, 3, 2, respectively). g Clustering analysis of the differentially expressed genes obtained from AML cells harvested from mouse bone marrow with or without chemotherapy (day 7). h GO analysis of the differentially expressed genes obtained from AML cells harvested from mouse bone marrow with or without chemotherapy (day 7). i GSEA of differentially expressed genes obtained from AML cells harvested from mouse bone marrow with or without chemotherapy (day 7). j Correlation between the differentially expressed genes between with or without chemotherapy and those between mTORC1 high and low cells (analyzed in Fig. 3a). k Clonal diversity before and after chemotherapy. Barcodes are ordered by decreasing proportion and cumulative proportion was plotted. Steeper curves indicate higher levels of selection due to less barcodes representing a larger proportion of the population. mTORC1 high (solid line) and mTORC1 low (dashed line) barcodes come from the same experiment, so differences between the curves indicate selection for one relative to the other. For the technical detail about this analysis, see “Methods” section. b, d–f Pooled data from at least two independent experiments were shown. c Representative data from two independent experiments were shown. Statistical analysis was performed by using two-way paired t-test (*p < 0.05, **p < 0.01, ***p < 0.001).

