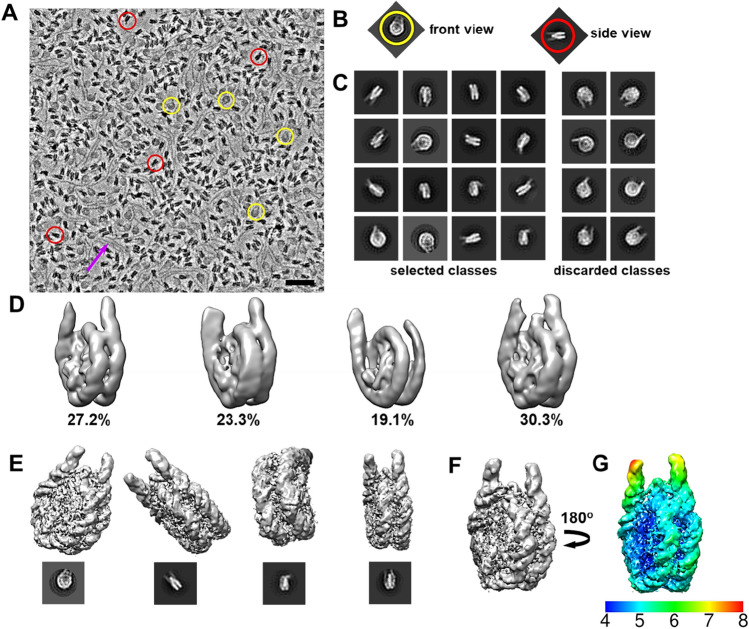
Figure 3.
Cryo-EM processing for the 601–177 human chromatosome. (A) A representative electron micrograph of the 601–177 chromatosome recorded with the Volta phase plate at 500 nm defocus. The arrow points at free DNA. The scale bar is 40 nm. (B) Representative 2D class averages of the chromatosome generated in RELION 3.0 (C) Typical disk and side view 2D class averages. The corresponding particle views in the micrograph are circled. (D) Representative 3D class averages obtained from 168,042 particles selected from the 2D classification. (E) EM map of the chromatosome after 3D refinement of the right-hand 3D class comprising 46,196 particles. Different views are shown. The filtered local res map is shown at a contour level of 0.0205. The corresponding 2D class averages are placed below. (F) Cryo-EM map of the final 601–177 chromatosome after refinement. (G) Local resolution estimated in RELION82,99. The volumes maps were calculated by RELION82,99 (www3.mrc-lmb.cam.ac.uk/relion/index.php/Main_Page) and visualised using CHIMERA83,84,94 (www.rbvi.ucsf.edu/chimera/).

