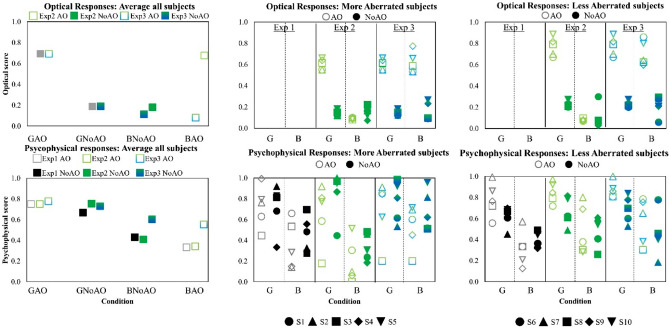
Figure 3.
Results summary. Optical image quality (top panels) and Psychophysical scores (bottom panels). Left panels represent average data across all subjects. Middle panels represent data of individuals with more aberrations (S#1–S#5; VS < 0.2), and right panels data of individual less aberrations (S#6–S#10; VS > 0.2). Open bars represent results under corrected monochromatic aberrations (AO) and filled bars under natural aberrations (NoAO). Gray bars represent results for grayscale images (Exp 1), Green bars for green images (Exp 2) and graded green–blue bars for green and blue images (Exp 3). In the middle and right panels, open symbols stand for results under corrected monochromatic aberrations (AO) and closed symbols for results under natural aberrations (NoAO). Black symbols correspond to Exp 1, green symbols to Exp 2 and green and blue symbols to Exp 3.

