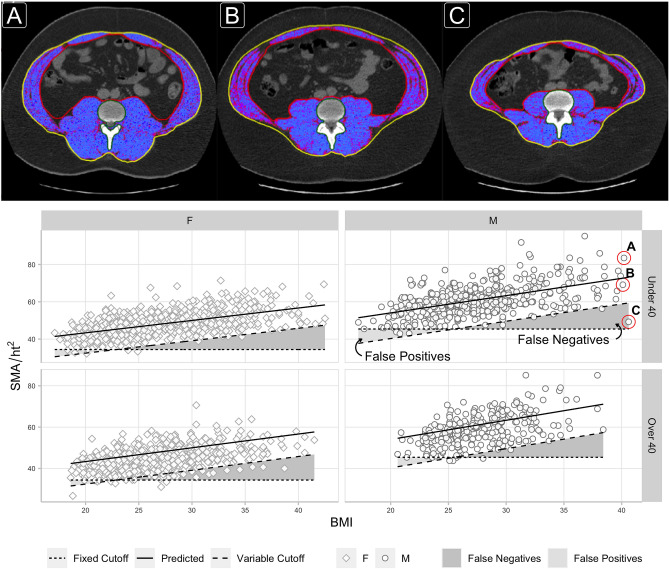
Figure 3.
L3 axial CT images highlighting skeletal muscle area for three males of similar age (28–29) and BMI 40.1–40.6, but different scores (A = 1.56, B = − 0.51, C = − 3.47) are compared. The third individual (C) has a muscle area more than 3 s.d. below the mean value expected for a BMI of 40. He would be classified as not sarcopenic using the fixed cutoff, but would be sarcopenic using the variable (z-score) cutoff. Scatter plots show L3 skeletal muscle area divided by height-squared () versus BMI, split by sex and cohort. Lines overlaid for (1) the mean value predicted by our linear regression model (solid line), (2) previously reported (Derstine, 2018)15 sarcopenia ‘fixed cutoff’ values (dotted line), and (3) bmi-adjusted ‘variable cutoff’ values (dashed line) computed as two s.d. below the predicted mean. Regions of ‘False Positives’ and ‘False Negatives’ sarcopenia diagnosis are shown based on the difference between the ‘fixed’ and ‘variable’ cutoffs.

