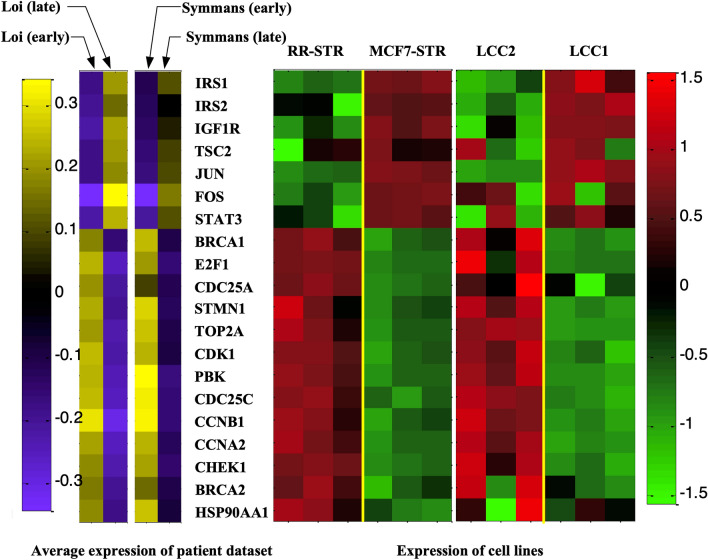
Figure 6.
Cell line validation for identified pathway genes from patient datasets. The left panel shows the average log2 expression of selected pathway genes. The right panel shows the log2 expression of two cell line studies: (MCF7-STRP vs. MCF7RR-STRP and LCC1 vs. LCC2). Seven genes (IRS1, IRS2, IGF1R, TSC2, JUN, FOS, STAT3) are consistently over-expressed in the ‘early recurrence’ patient samples and sensitive human breast cancer cell lines. The remaining genes, which mainly relate to cell cycle and apoptosis, are over-expressed in the resistant groups.

