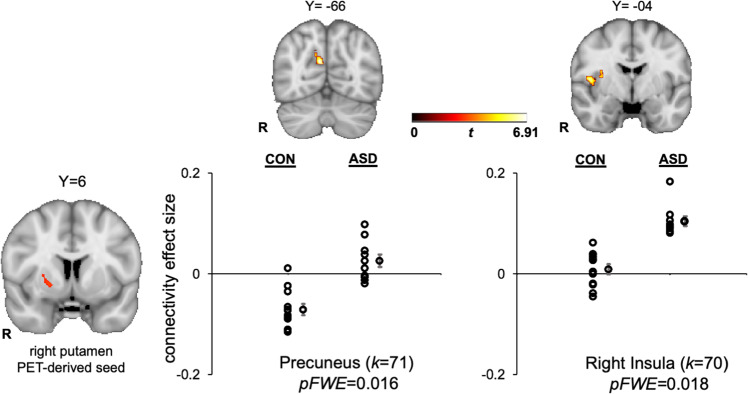
Fig. 3. ASD > control differences in general functional connectivity between the PET-derived right putamen seed and precuneus (MNI coordinates: X = 8, Y = −66, Z = 24) and right insula (MNI coordinates: X = 48, Y = −4, Z = 10).
Clusters are displayed in MNI152 space at peak coordinates for each target region and family-wise-error cluster corrected at p < 0.05. The dot plots show the effect size for each target region, represented by the Fisher-transformed correlation coefficients, separated by group. Individual data points are displayed next to the group average with standard error bars. k = cluster size in voxels.

