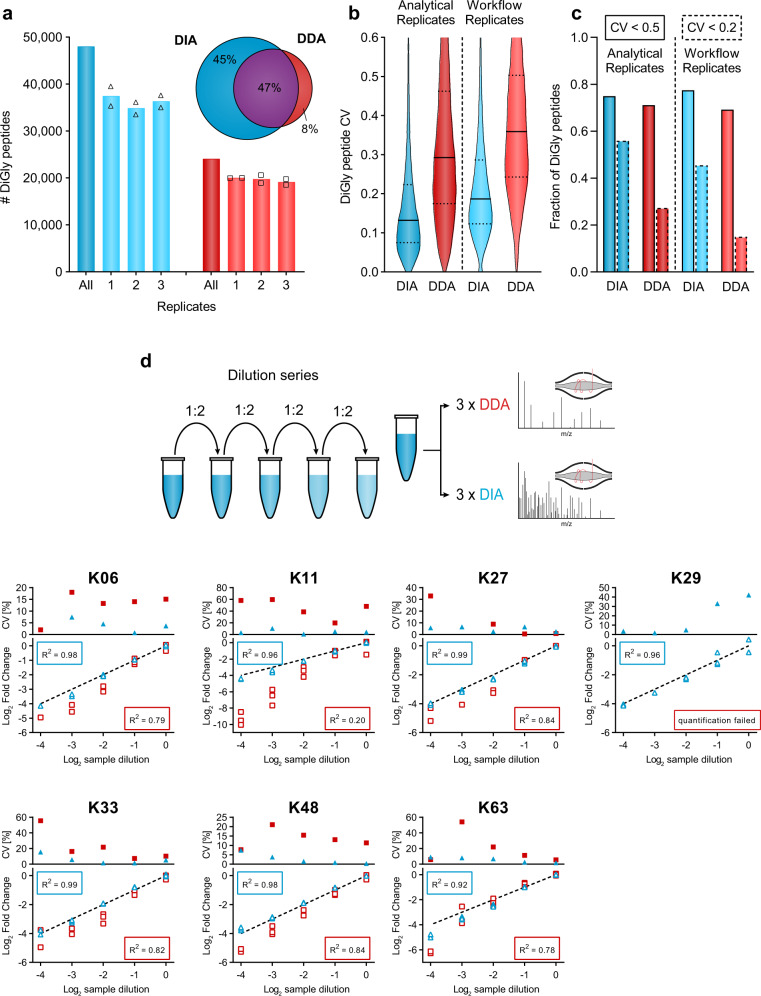
Fig. 2. Accurate and reproducible diGly proteomics for DIA quantification.
a Number of identified diGly peptides (mean, n = 2) for data-independent acquisition (DIA, blue, HEK293 hybrid library) and data-dependent acquisition (DDA, red) strategies (n = 6, three workflow replicates measured in analytical duplicates). Venn diagram depicts the proportion of shared and exclusively identified diGly sites between DIA and DDA approaches. b Coefficient of variation (CV) value distribution for DIA and DDA approaches. Solid and dotted lines denote median and 1st or 3rd quantile, respectively. c Fractions of CV values below 50% and 20% are shown with solid and dotted lines, respectively. d Dilution series of diGly enriched sample. Plots show individual ubiquitin-chain linkage type peptides measured via DIA (blue) or DDA (red) (n = 3). Top panels depict CV values of replicate measurements. Bottom panels show individual measurements compared to the expected dilution depicted as dotted line. R2 values describe the goodness-of-fit of measured values to the expected dilution series (dotted line). Source data are provided as a Source data file.

