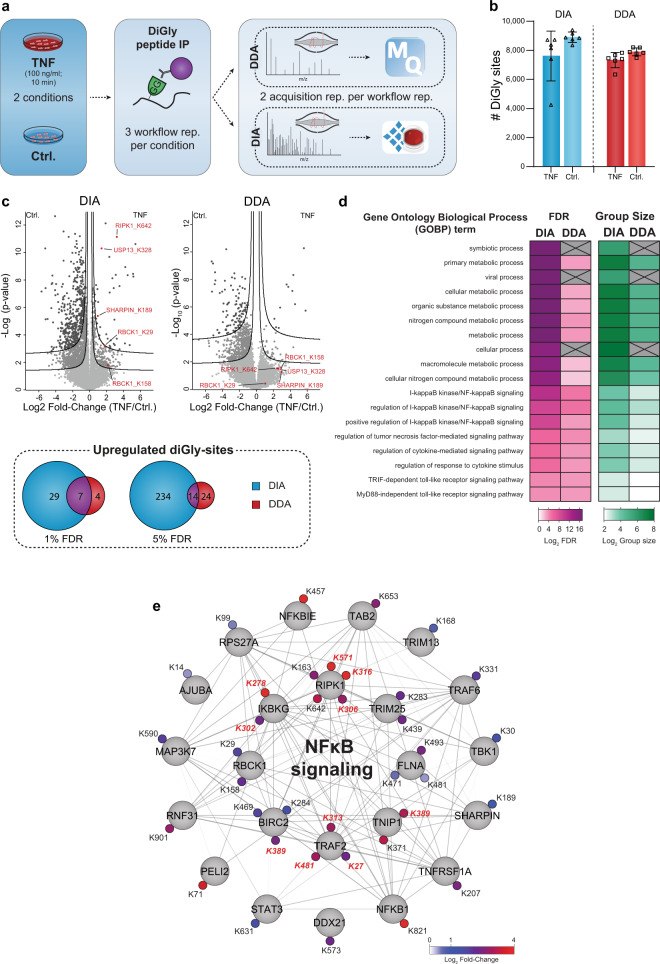
Fig. 3. DIA enables a detailed view of the TNF-regulated ubiquitinome.
a Workflow for ubiquitinome analysis in tumor necrosis factor (TNF) signaling. b Identified diGly sites (±SD) for TNF treated (100 ng/ml for 10 min) and control U2OS cells in data-independent acquisition (DIA, blue) and data-dependent acquisition (DDA, red) experiments (n = 6, three workflow replicates measured in analytical duplicates). c Volcano plot of significantly regulated diGly sites at 5% false discovery rate (FDR) (FDR controlled, two-sided t-test, randomizations = 250, s0 = 0.1) (lower line) and 1% (upper line) for DIA (blue) and DDA (red) and overlaps of significantly upregulated diGly sites for 1 and 5% FDR cutoffs (t-test, s0 = 0.1). d Overrepresentation analysis of gene ontology biological process (GOBP) terms filtered for 5% corrected FDR (Fisher’s Exact test). e Cytoscape network of proteins with significantly upregulated diGly sites in DIA that are associated with NFκB signaling (GO 0043122; GO 0051092; 5% FDR). Upregulated diGly sites also captured by DDA are marked in red (5% FDR). Source data are provided as a Source data file.

