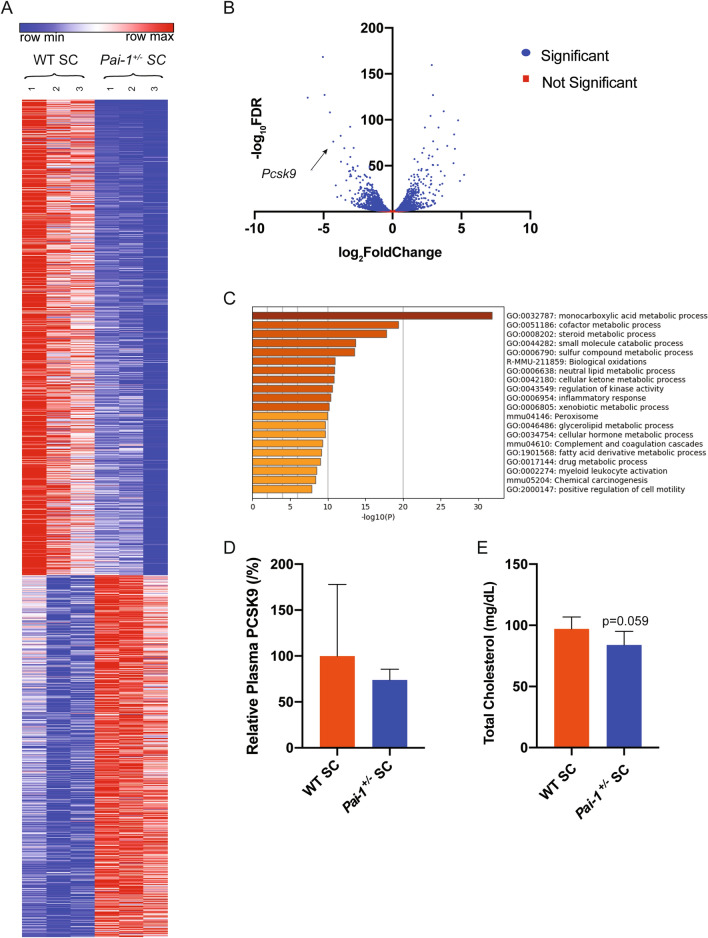
Figure 2.
Lipid metabolism is differentially regulated in PAI-1 heterozygosity. RNA-SEQ was performed on hepatic mRNA from 20 week-old Pai-1+/− and littermate WT control C57BL/6 J male mice fed SC (n = 3). (A) Hierarchical clustering of expression changes seen by RNA-seq. Heat map created using Morpheus (https://software.broadinstitute.org/morpheus/). (B) Volcano plot representation of all gene expression changes. Blue points represent statistically significant changes and red points represent non-significant changes. (C) Gene ontology analysis of statistical differentially expressed genes. Data generated using Metascape (https://metascape.org/gp/index.html#/main/step1). (D) Murine PCSK9 plasma levels. (E) Total cholesterol plasma levels. Values are express as mean ± SEM (n = 7).

