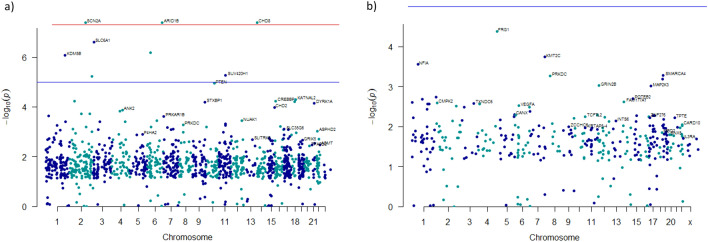
Figure 1.
Manhattan plots depicting the ASD risk genes prioritized by TADA-Denovo (chromosome and log10 p value for each gene are represented in axis x and y). (a) p values were obtained from analysis of germinal mutations in the combined cohort using TADA-Denovo. Red line represents the p value < 1 × 10⁻⁸ and blue line p value < 1 × 10⁻⁵. (b) p values were obtained from analysis of PZMs in the combined cohort using TADA-Denovo. Blue line represents p value < 1 × 10⁻⁵.

