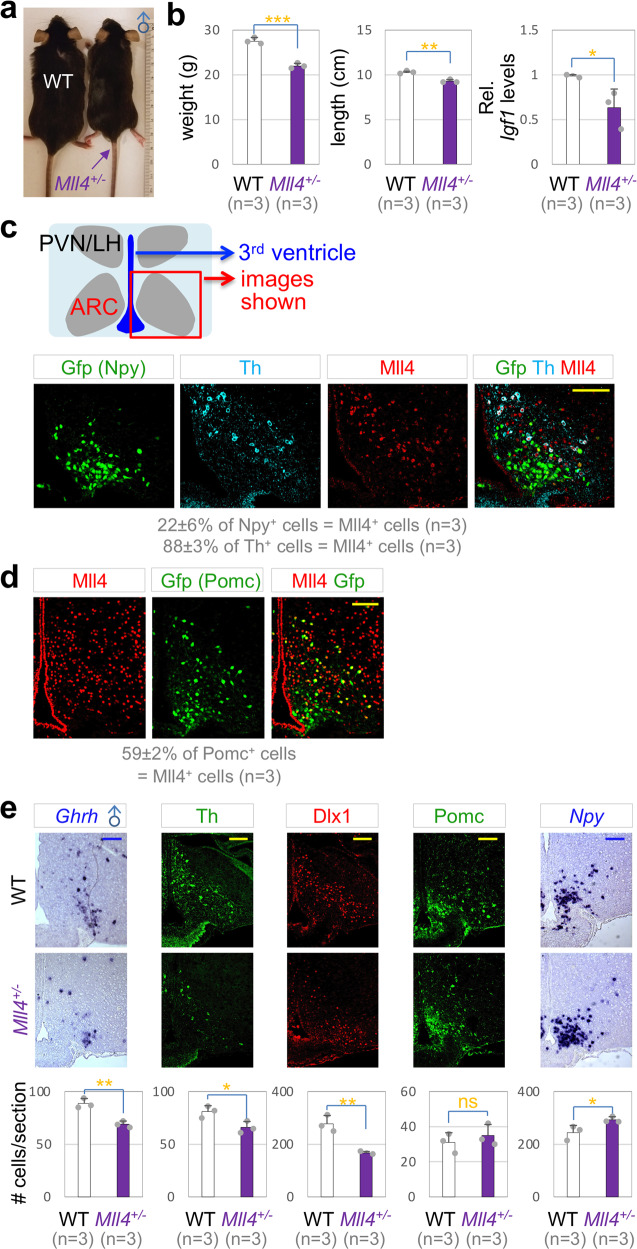
Fig. 1. Dwarfism of Mll4+/− mice.
a Mll4+/− male mice are smaller than their littermate WT mice at P80. b A significant reduction in body weight as well as linear length and liver Igf1 levels in male Mll4+/− mice relative to their littermate WT mice at P80. c, e Coexpression of Mll4 (IHC) with either Gfp driven by Npy-Gfp or Th (IHC) at P33 (c), and with Gfp driven by Pomc-Gfp at P33 (d). e Expression of Ghrh, Th, Dlx1, Pomc, and Npy in the ARC of male WT mice and their littermate Mll4+/− mice at P80, assessed by ISH (Ghrh, Npy) and IHC (Th, Dlx1, POMC). Quantifications were done by counting the number of labeled cells in three rostral to caudal sections for each mouse, and the number of mice used is as indicated in parenthesis (c–e). The location of ISH/IHC images is schematically shown (c), which applies to all images in (c–e). Scale bars, 100 µm. Statistical differences were determined by two-sided Student’s t-test (b, e); *p < 0.05, **p < 0.01, ***p < 0.001, and not significant (ns). Column bars represent mean, error bars indicate the SD (b, e).

